Immigrants from Portugal vs Estonian 1st Grade
COMPARE
Immigrants from Portugal
Estonian
1st Grade
1st Grade Comparison
Immigrants from Portugal
Estonians
97.3%
1ST GRADE
0.0/ 100
METRIC RATING
285th/ 347
METRIC RANK
98.4%
1ST GRADE
99.8/ 100
METRIC RATING
51st/ 347
METRIC RANK
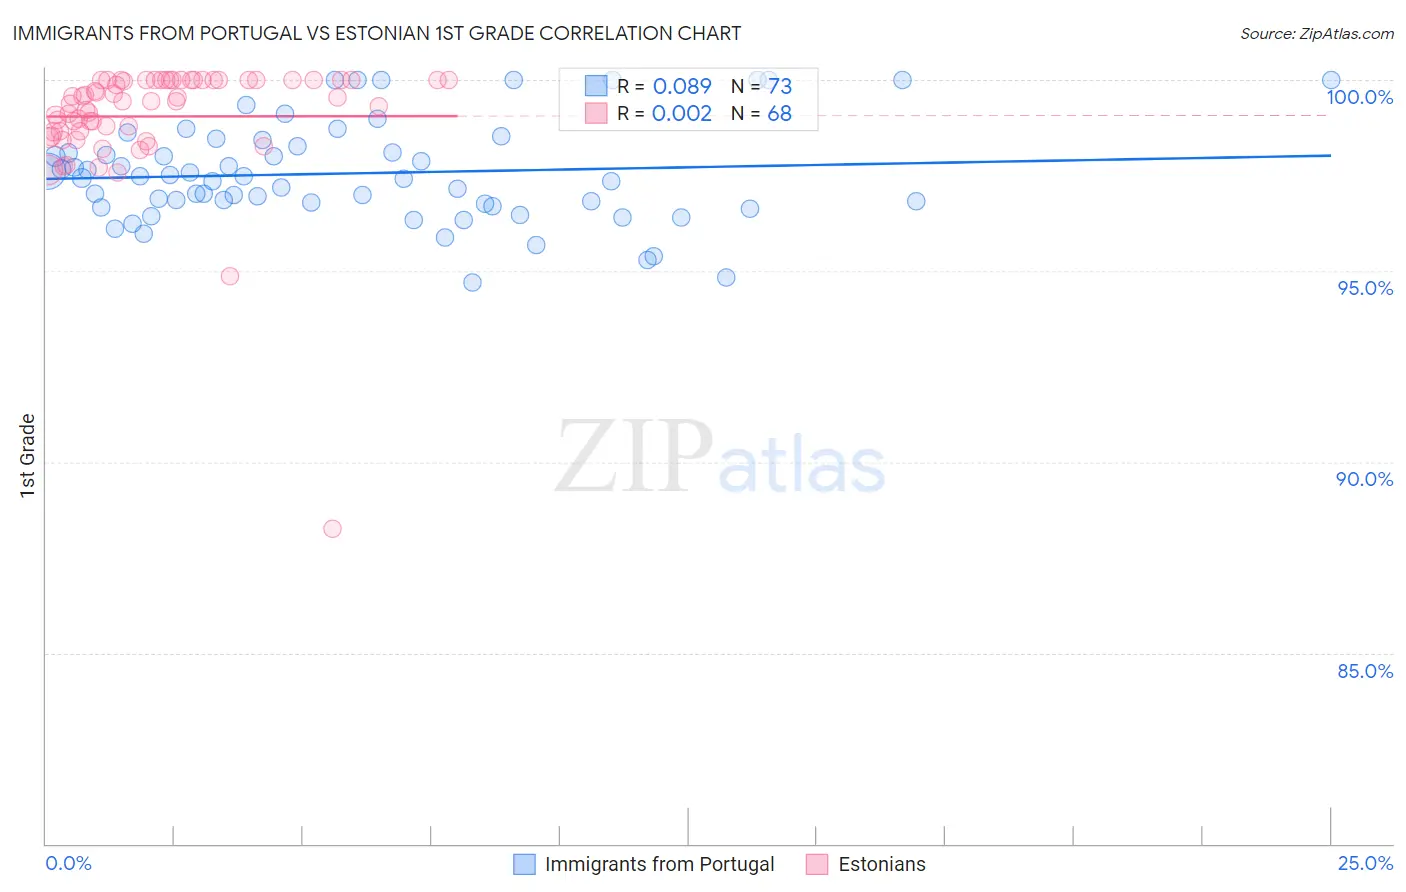
Immigrants from Portugal vs Estonian 1st Grade Correlation Chart
The statistical analysis conducted on geographies consisting of 174,792,107 people shows a slight positive correlation between the proportion of Immigrants from Portugal and percentage of population with at least 1st grade education in the United States with a correlation coefficient (R) of 0.089 and weighted average of 97.3%. Similarly, the statistical analysis conducted on geographies consisting of 123,528,404 people shows no correlation between the proportion of Estonians and percentage of population with at least 1st grade education in the United States with a correlation coefficient (R) of 0.002 and weighted average of 98.4%, a difference of 1.1%.
1st Grade Correlation Summary
| Measurement | Immigrants from Portugal | Estonian |
| Minimum | 94.7% | 88.3% |
| Maximum | 100.0% | 100.0% |
| Range | 5.3% | 11.7% |
| Mean | 97.6% | 99.0% |
| Median | 97.4% | 99.4% |
| Interquartile 25% (IQ1) | 96.7% | 98.7% |
| Interquartile 75% (IQ3) | 98.3% | 100.0% |
| Interquartile Range (IQR) | 1.6% | 1.3% |
| Standard Deviation (Sample) | 1.3% | 1.6% |
| Standard Deviation (Population) | 1.3% | 1.6% |
Similar Demographics by 1st Grade
Demographics Similar to Immigrants from Portugal by 1st Grade
In terms of 1st grade, the demographic groups most similar to Immigrants from Portugal are Immigrants from Trinidad and Tobago (97.3%, a difference of 0.0%), Immigrants from West Indies (97.3%, a difference of 0.010%), Immigrants from Barbados (97.3%, a difference of 0.010%), Immigrants from Hong Kong (97.3%, a difference of 0.030%), and Immigrants from Thailand (97.3%, a difference of 0.030%).
| Demographics | Rating | Rank | 1st Grade |
| Immigrants | Uzbekistan | 0.1 /100 | #278 | Tragic 97.4% |
| Immigrants | Ghana | 0.1 /100 | #279 | Tragic 97.4% |
| Afghans | 0.1 /100 | #280 | Tragic 97.4% |
| Trinidadians and Tobagonians | 0.1 /100 | #281 | Tragic 97.3% |
| Barbadians | 0.1 /100 | #282 | Tragic 97.3% |
| Immigrants | West Indies | 0.0 /100 | #283 | Tragic 97.3% |
| Immigrants | Trinidad and Tobago | 0.0 /100 | #284 | Tragic 97.3% |
| Immigrants | Portugal | 0.0 /100 | #285 | Tragic 97.3% |
| Immigrants | Barbados | 0.0 /100 | #286 | Tragic 97.3% |
| Immigrants | Hong Kong | 0.0 /100 | #287 | Tragic 97.3% |
| Immigrants | Thailand | 0.0 /100 | #288 | Tragic 97.3% |
| Immigrants | Afghanistan | 0.0 /100 | #289 | Tragic 97.3% |
| Immigrants | St. Vincent and the Grenadines | 0.0 /100 | #290 | Tragic 97.3% |
| Houma | 0.0 /100 | #291 | Tragic 97.2% |
| British West Indians | 0.0 /100 | #292 | Tragic 97.2% |
Demographics Similar to Estonians by 1st Grade
In terms of 1st grade, the demographic groups most similar to Estonians are Celtic (98.4%, a difference of 0.0%), White/Caucasian (98.4%, a difference of 0.0%), Pueblo (98.4%, a difference of 0.0%), Kiowa (98.4%, a difference of 0.0%), and Australian (98.4%, a difference of 0.0%).
| Demographics | Rating | Rank | 1st Grade |
| Northern Europeans | 99.9 /100 | #44 | Exceptional 98.5% |
| Belgians | 99.9 /100 | #45 | Exceptional 98.4% |
| Hungarians | 99.9 /100 | #46 | Exceptional 98.4% |
| Ottawa | 99.8 /100 | #47 | Exceptional 98.4% |
| Czechoslovakians | 99.8 /100 | #48 | Exceptional 98.4% |
| Celtics | 99.8 /100 | #49 | Exceptional 98.4% |
| Whites/Caucasians | 99.8 /100 | #50 | Exceptional 98.4% |
| Estonians | 99.8 /100 | #51 | Exceptional 98.4% |
| Pueblo | 99.8 /100 | #52 | Exceptional 98.4% |
| Kiowa | 99.8 /100 | #53 | Exceptional 98.4% |
| Australians | 99.8 /100 | #54 | Exceptional 98.4% |
| Immigrants | Scotland | 99.8 /100 | #55 | Exceptional 98.4% |
| Americans | 99.8 /100 | #56 | Exceptional 98.4% |
| Austrians | 99.8 /100 | #57 | Exceptional 98.4% |
| New Zealanders | 99.7 /100 | #58 | Exceptional 98.4% |