Immigrants from Portugal vs Immigrants from Panama Disability Age Under 5
COMPARE
Immigrants from Portugal
Immigrants from Panama
Disability Age Under 5
Disability Age Under 5 Comparison
Immigrants from Portugal
Immigrants from Panama
1.8%
DISABILITY AGE UNDER 5
0.0/ 100
METRIC RATING
325th/ 347
METRIC RANK
1.2%
DISABILITY AGE UNDER 5
95.0/ 100
METRIC RATING
109th/ 347
METRIC RANK
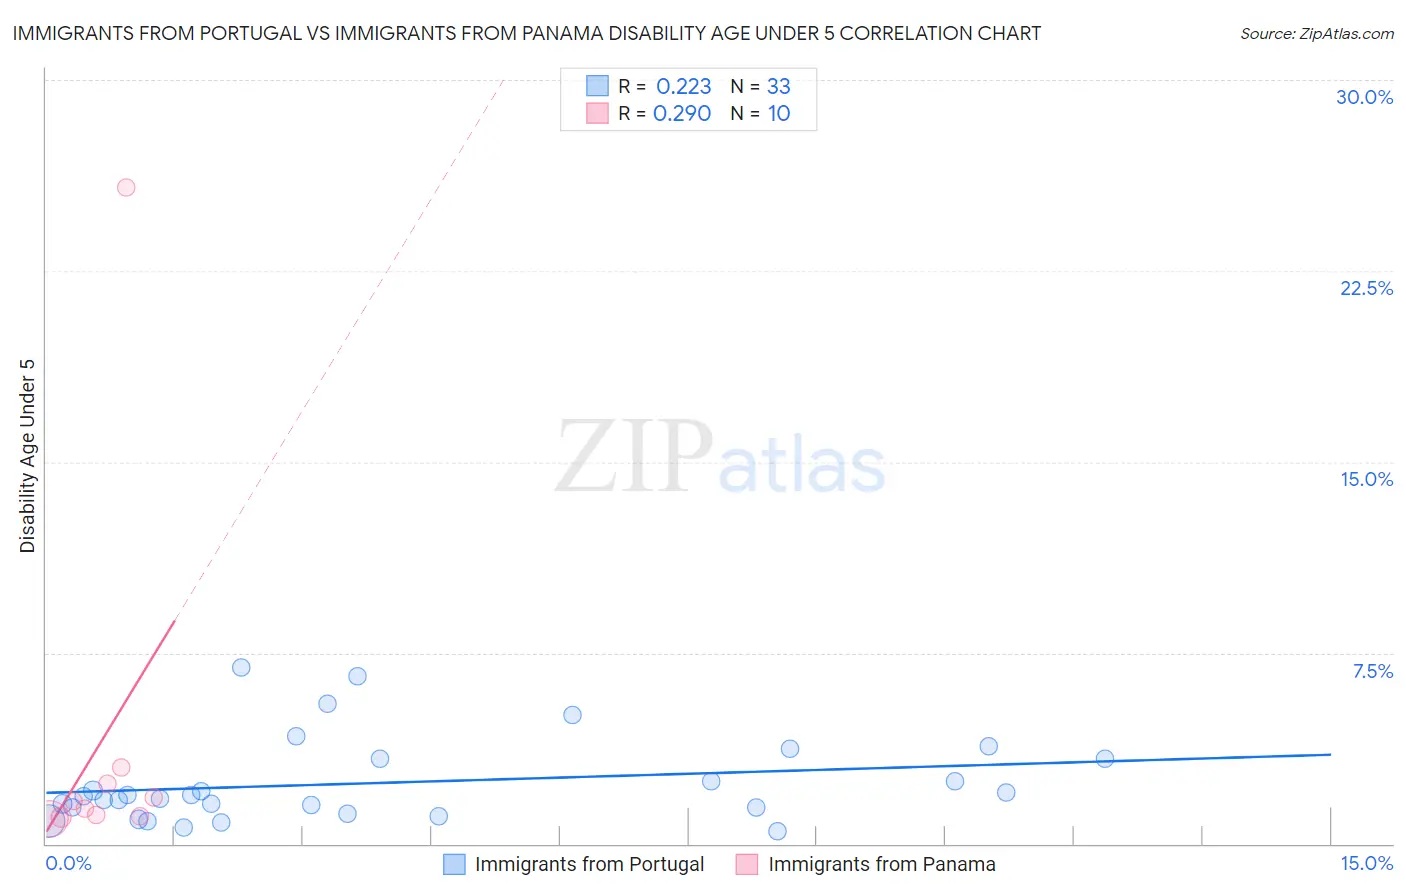
Immigrants from Portugal vs Immigrants from Panama Disability Age Under 5 Correlation Chart
The statistical analysis conducted on geographies consisting of 112,092,431 people shows a weak positive correlation between the proportion of Immigrants from Portugal and percentage of population with a disability under the age of 5 in the United States with a correlation coefficient (R) of 0.223 and weighted average of 1.8%. Similarly, the statistical analysis conducted on geographies consisting of 142,970,984 people shows a weak positive correlation between the proportion of Immigrants from Panama and percentage of population with a disability under the age of 5 in the United States with a correlation coefficient (R) of 0.290 and weighted average of 1.2%, a difference of 55.1%.
Disability Age Under 5 Correlation Summary
| Measurement | Immigrants from Portugal | Immigrants from Panama |
| Minimum | 0.48% | 1.0% |
| Maximum | 6.9% | 25.8% |
| Range | 6.5% | 24.8% |
| Mean | 2.4% | 4.0% |
| Median | 1.9% | 1.5% |
| Interquartile 25% (IQ1) | 1.3% | 1.1% |
| Interquartile 75% (IQ3) | 3.4% | 2.4% |
| Interquartile Range (IQR) | 2.1% | 1.3% |
| Standard Deviation (Sample) | 1.7% | 7.7% |
| Standard Deviation (Population) | 1.6% | 7.3% |
Similar Demographics by Disability Age Under 5
Demographics Similar to Immigrants from Portugal by Disability Age Under 5
In terms of disability age under 5, the demographic groups most similar to Immigrants from Portugal are Cherokee (1.8%, a difference of 1.3%), Sioux (1.8%, a difference of 1.4%), Osage (1.8%, a difference of 1.8%), Chickasaw (1.7%, a difference of 3.1%), and American (1.9%, a difference of 3.5%).
| Demographics | Rating | Rank | Disability Age Under 5 |
| Irish | 0.0 /100 | #318 | Tragic 1.7% |
| Slovaks | 0.0 /100 | #319 | Tragic 1.7% |
| Scotch-Irish | 0.0 /100 | #320 | Tragic 1.7% |
| Ottawa | 0.0 /100 | #321 | Tragic 1.7% |
| Germans | 0.0 /100 | #322 | Tragic 1.7% |
| Chickasaw | 0.0 /100 | #323 | Tragic 1.7% |
| Cherokee | 0.0 /100 | #324 | Tragic 1.8% |
| Immigrants | Portugal | 0.0 /100 | #325 | Tragic 1.8% |
| Sioux | 0.0 /100 | #326 | Tragic 1.8% |
| Osage | 0.0 /100 | #327 | Tragic 1.8% |
| Americans | 0.0 /100 | #328 | Tragic 1.9% |
| Houma | 0.0 /100 | #329 | Tragic 1.9% |
| Choctaw | 0.0 /100 | #330 | Tragic 1.9% |
| French Canadians | 0.0 /100 | #331 | Tragic 1.9% |
| Chippewa | 0.0 /100 | #332 | Tragic 1.9% |
Demographics Similar to Immigrants from Panama by Disability Age Under 5
In terms of disability age under 5, the demographic groups most similar to Immigrants from Panama are Iraqi (1.2%, a difference of 0.020%), Immigrants from Lebanon (1.2%, a difference of 0.020%), Immigrants from West Indies (1.2%, a difference of 0.15%), Cambodian (1.2%, a difference of 0.19%), and Senegalese (1.2%, a difference of 0.22%).
| Demographics | Rating | Rank | Disability Age Under 5 |
| Immigrants | Morocco | 96.0 /100 | #102 | Exceptional 1.2% |
| Immigrants | Nicaragua | 96.0 /100 | #103 | Exceptional 1.2% |
| Indonesians | 95.9 /100 | #104 | Exceptional 1.2% |
| Immigrants | South Africa | 95.6 /100 | #105 | Exceptional 1.2% |
| Cambodians | 95.4 /100 | #106 | Exceptional 1.2% |
| Immigrants | West Indies | 95.3 /100 | #107 | Exceptional 1.2% |
| Iraqis | 95.1 /100 | #108 | Exceptional 1.2% |
| Immigrants | Panama | 95.0 /100 | #109 | Exceptional 1.2% |
| Immigrants | Lebanon | 95.0 /100 | #110 | Exceptional 1.2% |
| Senegalese | 94.6 /100 | #111 | Exceptional 1.2% |
| Immigrants | Australia | 94.4 /100 | #112 | Exceptional 1.2% |
| Immigrants | Oceania | 94.2 /100 | #113 | Exceptional 1.2% |
| Belizeans | 93.9 /100 | #114 | Exceptional 1.2% |
| Immigrants | Caribbean | 93.8 /100 | #115 | Exceptional 1.2% |
| Immigrants | Northern Africa | 93.8 /100 | #116 | Exceptional 1.2% |