Immigrants from Portugal vs Salvadoran Disability Age Under 5
COMPARE
Immigrants from Portugal
Salvadoran
Disability Age Under 5
Disability Age Under 5 Comparison
Immigrants from Portugal
Salvadorans
1.8%
DISABILITY AGE UNDER 5
0.0/ 100
METRIC RATING
325th/ 347
METRIC RANK
1.1%
DISABILITY AGE UNDER 5
99.5/ 100
METRIC RATING
55th/ 347
METRIC RANK
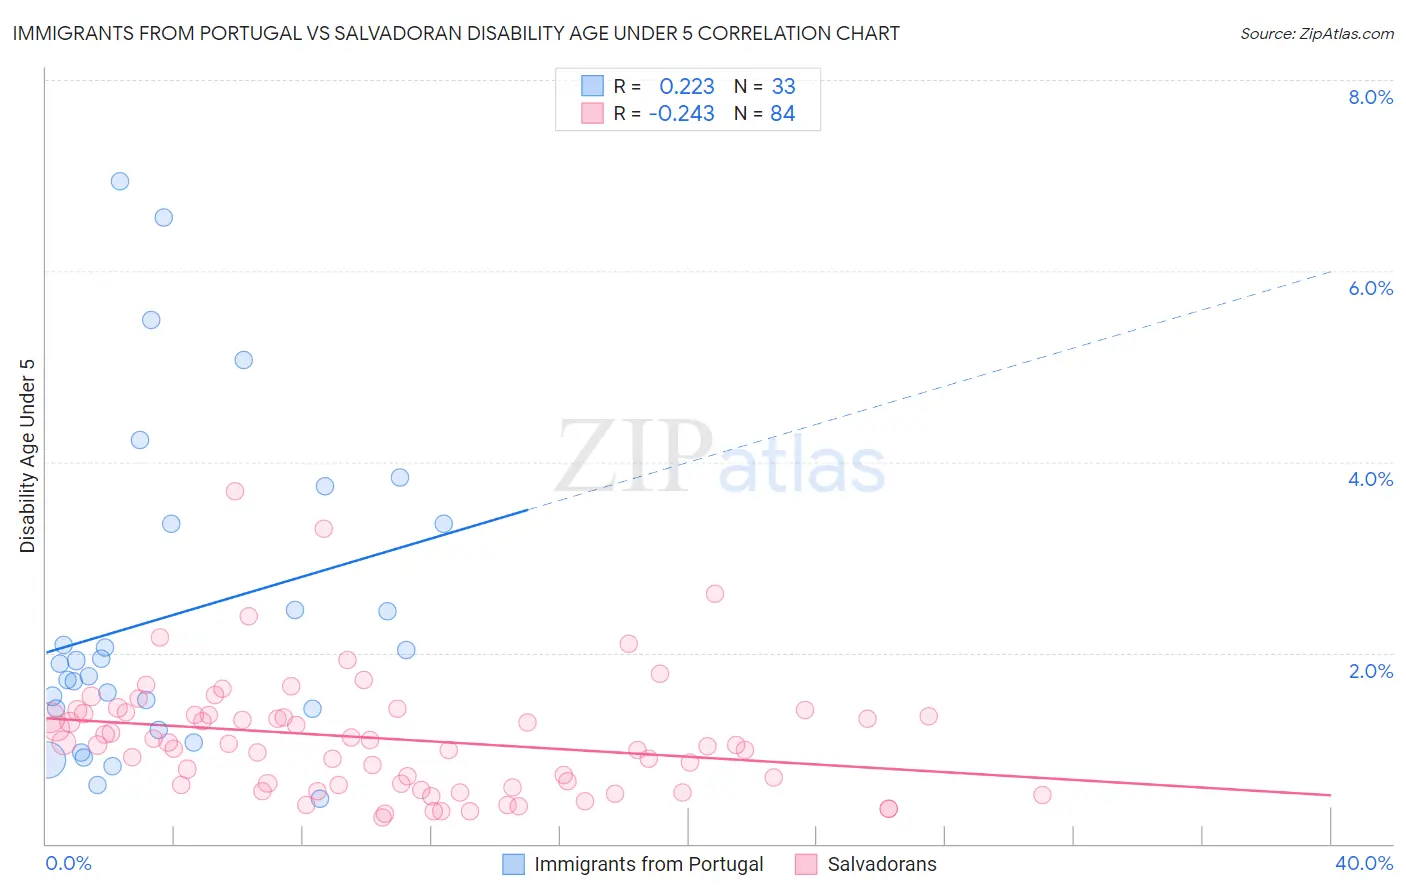
Immigrants from Portugal vs Salvadoran Disability Age Under 5 Correlation Chart
The statistical analysis conducted on geographies consisting of 112,092,431 people shows a weak positive correlation between the proportion of Immigrants from Portugal and percentage of population with a disability under the age of 5 in the United States with a correlation coefficient (R) of 0.223 and weighted average of 1.8%. Similarly, the statistical analysis conducted on geographies consisting of 220,785,812 people shows a weak negative correlation between the proportion of Salvadorans and percentage of population with a disability under the age of 5 in the United States with a correlation coefficient (R) of -0.243 and weighted average of 1.1%, a difference of 64.8%.
Disability Age Under 5 Correlation Summary
| Measurement | Immigrants from Portugal | Salvadoran |
| Minimum | 0.48% | 0.27% |
| Maximum | 6.9% | 3.7% |
| Range | 6.5% | 3.4% |
| Mean | 2.4% | 1.1% |
| Median | 1.9% | 1.0% |
| Interquartile 25% (IQ1) | 1.3% | 0.62% |
| Interquartile 75% (IQ3) | 3.4% | 1.4% |
| Interquartile Range (IQR) | 2.1% | 0.74% |
| Standard Deviation (Sample) | 1.7% | 0.63% |
| Standard Deviation (Population) | 1.6% | 0.62% |
Similar Demographics by Disability Age Under 5
Demographics Similar to Immigrants from Portugal by Disability Age Under 5
In terms of disability age under 5, the demographic groups most similar to Immigrants from Portugal are Cherokee (1.8%, a difference of 1.3%), Sioux (1.8%, a difference of 1.4%), Osage (1.8%, a difference of 1.8%), Chickasaw (1.7%, a difference of 3.1%), and American (1.9%, a difference of 3.5%).
| Demographics | Rating | Rank | Disability Age Under 5 |
| Irish | 0.0 /100 | #318 | Tragic 1.7% |
| Slovaks | 0.0 /100 | #319 | Tragic 1.7% |
| Scotch-Irish | 0.0 /100 | #320 | Tragic 1.7% |
| Ottawa | 0.0 /100 | #321 | Tragic 1.7% |
| Germans | 0.0 /100 | #322 | Tragic 1.7% |
| Chickasaw | 0.0 /100 | #323 | Tragic 1.7% |
| Cherokee | 0.0 /100 | #324 | Tragic 1.8% |
| Immigrants | Portugal | 0.0 /100 | #325 | Tragic 1.8% |
| Sioux | 0.0 /100 | #326 | Tragic 1.8% |
| Osage | 0.0 /100 | #327 | Tragic 1.8% |
| Americans | 0.0 /100 | #328 | Tragic 1.9% |
| Houma | 0.0 /100 | #329 | Tragic 1.9% |
| Choctaw | 0.0 /100 | #330 | Tragic 1.9% |
| French Canadians | 0.0 /100 | #331 | Tragic 1.9% |
| Chippewa | 0.0 /100 | #332 | Tragic 1.9% |
Demographics Similar to Salvadorans by Disability Age Under 5
In terms of disability age under 5, the demographic groups most similar to Salvadorans are Immigrants from El Salvador (1.1%, a difference of 0.090%), Asian (1.1%, a difference of 0.38%), Ecuadorian (1.1%, a difference of 0.39%), Assyrian/Chaldean/Syriac (1.1%, a difference of 0.42%), and Immigrants from Egypt (1.1%, a difference of 0.61%).
| Demographics | Rating | Rank | Disability Age Under 5 |
| Immigrants | Singapore | 99.7 /100 | #48 | Exceptional 1.1% |
| Immigrants | Russia | 99.7 /100 | #49 | Exceptional 1.1% |
| Immigrants | Japan | 99.7 /100 | #50 | Exceptional 1.1% |
| Immigrants | Kazakhstan | 99.7 /100 | #51 | Exceptional 1.1% |
| Immigrants | Bolivia | 99.6 /100 | #52 | Exceptional 1.1% |
| Asians | 99.6 /100 | #53 | Exceptional 1.1% |
| Immigrants | El Salvador | 99.6 /100 | #54 | Exceptional 1.1% |
| Salvadorans | 99.5 /100 | #55 | Exceptional 1.1% |
| Ecuadorians | 99.5 /100 | #56 | Exceptional 1.1% |
| Assyrians/Chaldeans/Syriacs | 99.5 /100 | #57 | Exceptional 1.1% |
| Immigrants | Egypt | 99.4 /100 | #58 | Exceptional 1.1% |
| Immigrants | Malaysia | 99.4 /100 | #59 | Exceptional 1.1% |
| Immigrants | Western Asia | 99.2 /100 | #60 | Exceptional 1.1% |
| Immigrants | Ethiopia | 99.2 /100 | #61 | Exceptional 1.1% |
| Immigrants | Switzerland | 99.2 /100 | #62 | Exceptional 1.1% |