Immigrants from Portugal vs Egyptian Ambulatory Disability
COMPARE
Immigrants from Portugal
Egyptian
Ambulatory Disability
Ambulatory Disability Comparison
Immigrants from Portugal
Egyptians
6.5%
AMBULATORY DISABILITY
1.4/ 100
METRIC RATING
248th/ 347
METRIC RANK
5.6%
AMBULATORY DISABILITY
99.9/ 100
METRIC RATING
46th/ 347
METRIC RANK
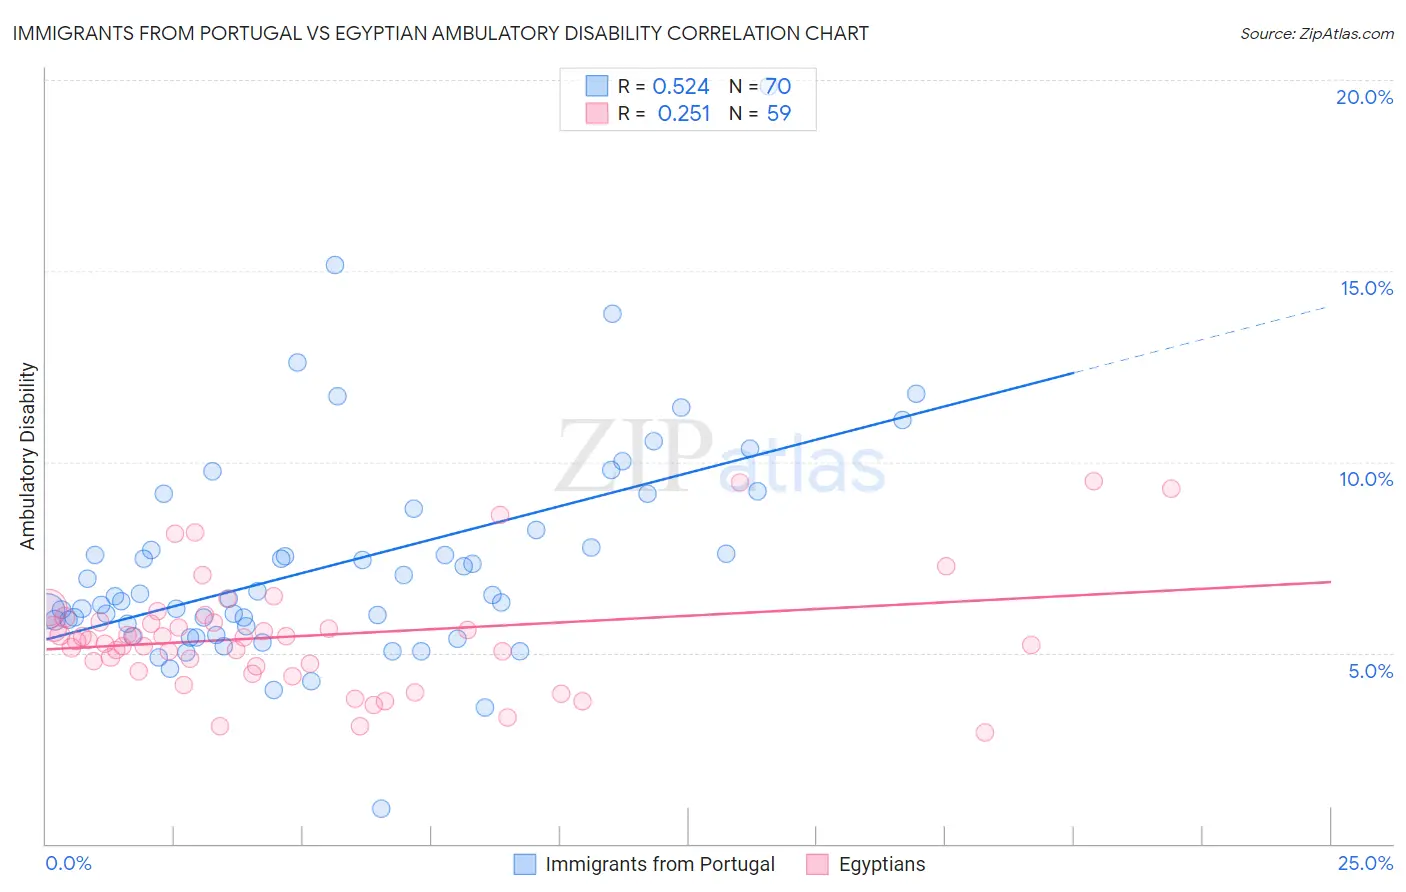
Immigrants from Portugal vs Egyptian Ambulatory Disability Correlation Chart
The statistical analysis conducted on geographies consisting of 174,768,730 people shows a substantial positive correlation between the proportion of Immigrants from Portugal and percentage of population with ambulatory disability in the United States with a correlation coefficient (R) of 0.524 and weighted average of 6.5%. Similarly, the statistical analysis conducted on geographies consisting of 276,859,552 people shows a weak positive correlation between the proportion of Egyptians and percentage of population with ambulatory disability in the United States with a correlation coefficient (R) of 0.251 and weighted average of 5.6%, a difference of 16.3%.
Ambulatory Disability Correlation Summary
| Measurement | Immigrants from Portugal | Egyptian |
| Minimum | 0.93% | 2.9% |
| Maximum | 19.8% | 9.5% |
| Range | 18.9% | 6.6% |
| Mean | 7.3% | 5.4% |
| Median | 6.5% | 5.3% |
| Interquartile 25% (IQ1) | 5.7% | 4.7% |
| Interquartile 75% (IQ3) | 8.2% | 5.8% |
| Interquartile Range (IQR) | 2.5% | 1.2% |
| Standard Deviation (Sample) | 2.9% | 1.5% |
| Standard Deviation (Population) | 2.9% | 1.5% |
Similar Demographics by Ambulatory Disability
Demographics Similar to Immigrants from Portugal by Ambulatory Disability
In terms of ambulatory disability, the demographic groups most similar to Immigrants from Portugal are Immigrants from Cuba (6.5%, a difference of 0.020%), Armenian (6.5%, a difference of 0.070%), Tlingit-Haida (6.5%, a difference of 0.090%), German (6.5%, a difference of 0.12%), and Immigrants from Panama (6.5%, a difference of 0.12%).
| Demographics | Rating | Rank | Ambulatory Disability |
| Immigrants | Haiti | 1.6 /100 | #241 | Tragic 6.5% |
| Spaniards | 1.6 /100 | #242 | Tragic 6.5% |
| Germans | 1.5 /100 | #243 | Tragic 6.5% |
| Immigrants | Panama | 1.5 /100 | #244 | Tragic 6.5% |
| Tlingit-Haida | 1.5 /100 | #245 | Tragic 6.5% |
| Armenians | 1.5 /100 | #246 | Tragic 6.5% |
| Immigrants | Cuba | 1.4 /100 | #247 | Tragic 6.5% |
| Immigrants | Portugal | 1.4 /100 | #248 | Tragic 6.5% |
| Native Hawaiians | 1.1 /100 | #249 | Tragic 6.5% |
| Chinese | 1.0 /100 | #250 | Tragic 6.5% |
| Hawaiians | 0.9 /100 | #251 | Tragic 6.5% |
| Immigrants | Bahamas | 0.8 /100 | #252 | Tragic 6.5% |
| Scottish | 0.7 /100 | #253 | Tragic 6.5% |
| Belizeans | 0.7 /100 | #254 | Tragic 6.5% |
| Welsh | 0.6 /100 | #255 | Tragic 6.5% |
Demographics Similar to Egyptians by Ambulatory Disability
In terms of ambulatory disability, the demographic groups most similar to Egyptians are Immigrants from Japan (5.6%, a difference of 0.0%), Immigrants from Sweden (5.6%, a difference of 0.010%), Immigrants from Argentina (5.6%, a difference of 0.020%), Immigrants from Indonesia (5.5%, a difference of 0.18%), and Bulgarian (5.6%, a difference of 0.21%).
| Demographics | Rating | Rank | Ambulatory Disability |
| Immigrants | Eritrea | 100.0 /100 | #39 | Exceptional 5.5% |
| Venezuelans | 99.9 /100 | #40 | Exceptional 5.5% |
| Mongolians | 99.9 /100 | #41 | Exceptional 5.5% |
| Argentineans | 99.9 /100 | #42 | Exceptional 5.5% |
| Paraguayans | 99.9 /100 | #43 | Exceptional 5.5% |
| Immigrants | Indonesia | 99.9 /100 | #44 | Exceptional 5.5% |
| Immigrants | Sweden | 99.9 /100 | #45 | Exceptional 5.6% |
| Egyptians | 99.9 /100 | #46 | Exceptional 5.6% |
| Immigrants | Japan | 99.9 /100 | #47 | Exceptional 5.6% |
| Immigrants | Argentina | 99.9 /100 | #48 | Exceptional 5.6% |
| Bulgarians | 99.9 /100 | #49 | Exceptional 5.6% |
| Luxembourgers | 99.9 /100 | #50 | Exceptional 5.6% |
| Taiwanese | 99.8 /100 | #51 | Exceptional 5.6% |
| Jordanians | 99.8 /100 | #52 | Exceptional 5.6% |
| Immigrants | Egypt | 99.8 /100 | #53 | Exceptional 5.6% |