Immigrants from Poland vs Malaysian 12th Grade, No Diploma
COMPARE
Immigrants from Poland
Malaysian
12th Grade, No Diploma
12th Grade, No Diploma Comparison
Immigrants from Poland
Malaysians
91.6%
12TH GRADE, NO DIPLOMA
82.3/ 100
METRIC RATING
140th/ 347
METRIC RANK
89.2%
12TH GRADE, NO DIPLOMA
0.1/ 100
METRIC RATING
272nd/ 347
METRIC RANK
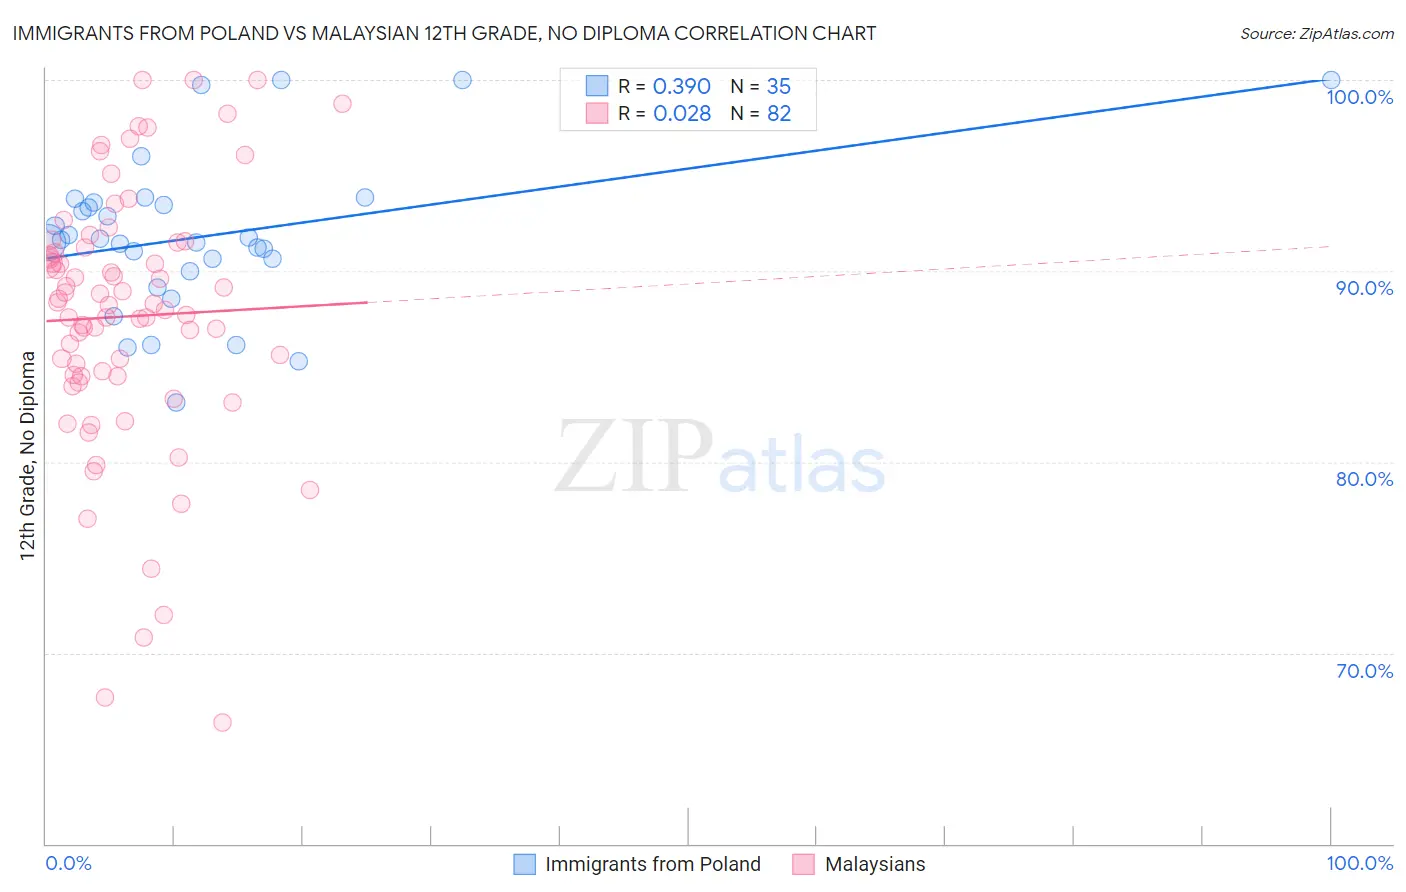
Immigrants from Poland vs Malaysian 12th Grade, No Diploma Correlation Chart
The statistical analysis conducted on geographies consisting of 304,861,877 people shows a mild positive correlation between the proportion of Immigrants from Poland and percentage of population with at least 12th grade (no diploma) education in the United States with a correlation coefficient (R) of 0.390 and weighted average of 91.6%. Similarly, the statistical analysis conducted on geographies consisting of 226,109,984 people shows no correlation between the proportion of Malaysians and percentage of population with at least 12th grade (no diploma) education in the United States with a correlation coefficient (R) of 0.028 and weighted average of 89.2%, a difference of 2.6%.
12th Grade, No Diploma Correlation Summary
| Measurement | Immigrants from Poland | Malaysian |
| Minimum | 83.1% | 66.4% |
| Maximum | 100.0% | 100.0% |
| Range | 16.9% | 33.6% |
| Mean | 91.8% | 87.6% |
| Median | 91.7% | 88.2% |
| Interquartile 25% (IQ1) | 90.0% | 84.5% |
| Interquartile 75% (IQ3) | 93.6% | 91.2% |
| Interquartile Range (IQR) | 3.6% | 6.7% |
| Standard Deviation (Sample) | 4.1% | 6.9% |
| Standard Deviation (Population) | 4.0% | 6.8% |
Similar Demographics by 12th Grade, No Diploma
Demographics Similar to Immigrants from Poland by 12th Grade, No Diploma
In terms of 12th grade, no diploma, the demographic groups most similar to Immigrants from Poland are Argentinean (91.6%, a difference of 0.010%), Immigrants from Egypt (91.6%, a difference of 0.030%), Immigrants from Venezuela (91.6%, a difference of 0.030%), Immigrants from Argentina (91.6%, a difference of 0.030%), and Arab (91.6%, a difference of 0.040%).
| Demographics | Rating | Rank | 12th Grade, No Diploma |
| Immigrants | Italy | 88.3 /100 | #133 | Excellent 91.7% |
| Venezuelans | 88.2 /100 | #134 | Excellent 91.7% |
| Immigrants | Bosnia and Herzegovina | 87.3 /100 | #135 | Excellent 91.7% |
| Chileans | 85.8 /100 | #136 | Excellent 91.7% |
| Alaska Natives | 84.9 /100 | #137 | Excellent 91.6% |
| Arabs | 84.1 /100 | #138 | Excellent 91.6% |
| Immigrants | Egypt | 83.9 /100 | #139 | Excellent 91.6% |
| Immigrants | Poland | 82.3 /100 | #140 | Excellent 91.6% |
| Argentineans | 82.0 /100 | #141 | Excellent 91.6% |
| Immigrants | Venezuela | 80.9 /100 | #142 | Excellent 91.6% |
| Immigrants | Argentina | 80.7 /100 | #143 | Excellent 91.6% |
| Immigrants | Spain | 80.1 /100 | #144 | Excellent 91.6% |
| Immigrants | Lebanon | 80.0 /100 | #145 | Excellent 91.6% |
| Immigrants | Brazil | 79.8 /100 | #146 | Good 91.5% |
| Pakistanis | 79.6 /100 | #147 | Good 91.5% |
Demographics Similar to Malaysians by 12th Grade, No Diploma
In terms of 12th grade, no diploma, the demographic groups most similar to Malaysians are Black/African American (89.3%, a difference of 0.010%), Bangladeshi (89.3%, a difference of 0.020%), U.S. Virgin Islander (89.3%, a difference of 0.060%), Immigrants from Trinidad and Tobago (89.3%, a difference of 0.10%), and Seminole (89.4%, a difference of 0.12%).
| Demographics | Rating | Rank | 12th Grade, No Diploma |
| Trinidadians and Tobagonians | 0.2 /100 | #265 | Tragic 89.4% |
| Seminole | 0.2 /100 | #266 | Tragic 89.4% |
| West Indians | 0.2 /100 | #267 | Tragic 89.3% |
| Immigrants | Trinidad and Tobago | 0.1 /100 | #268 | Tragic 89.3% |
| U.S. Virgin Islanders | 0.1 /100 | #269 | Tragic 89.3% |
| Bangladeshis | 0.1 /100 | #270 | Tragic 89.3% |
| Blacks/African Americans | 0.1 /100 | #271 | Tragic 89.3% |
| Malaysians | 0.1 /100 | #272 | Tragic 89.2% |
| Barbadians | 0.1 /100 | #273 | Tragic 89.1% |
| Cajuns | 0.1 /100 | #274 | Tragic 89.1% |
| Immigrants | Congo | 0.1 /100 | #275 | Tragic 89.0% |
| Ute | 0.1 /100 | #276 | Tragic 89.0% |
| Immigrants | Barbados | 0.0 /100 | #277 | Tragic 89.0% |
| Immigrants | St. Vincent and the Grenadines | 0.0 /100 | #278 | Tragic 88.9% |
| Immigrants | Laos | 0.0 /100 | #279 | Tragic 88.9% |