Immigrants from Panama vs Immigrants from Belize 3 or more Vehicles in Household
COMPARE
Immigrants from Panama
Immigrants from Belize
3 or more Vehicles in Household
3 or more Vehicles in Household Comparison
Immigrants from Panama
Immigrants from Belize
17.7%
3 OR MORE VEHICLES IN HOUSEHOLD
0.8/ 100
METRIC RATING
265th/ 347
METRIC RANK
18.1%
3 OR MORE VEHICLES IN HOUSEHOLD
2.1/ 100
METRIC RATING
245th/ 347
METRIC RANK
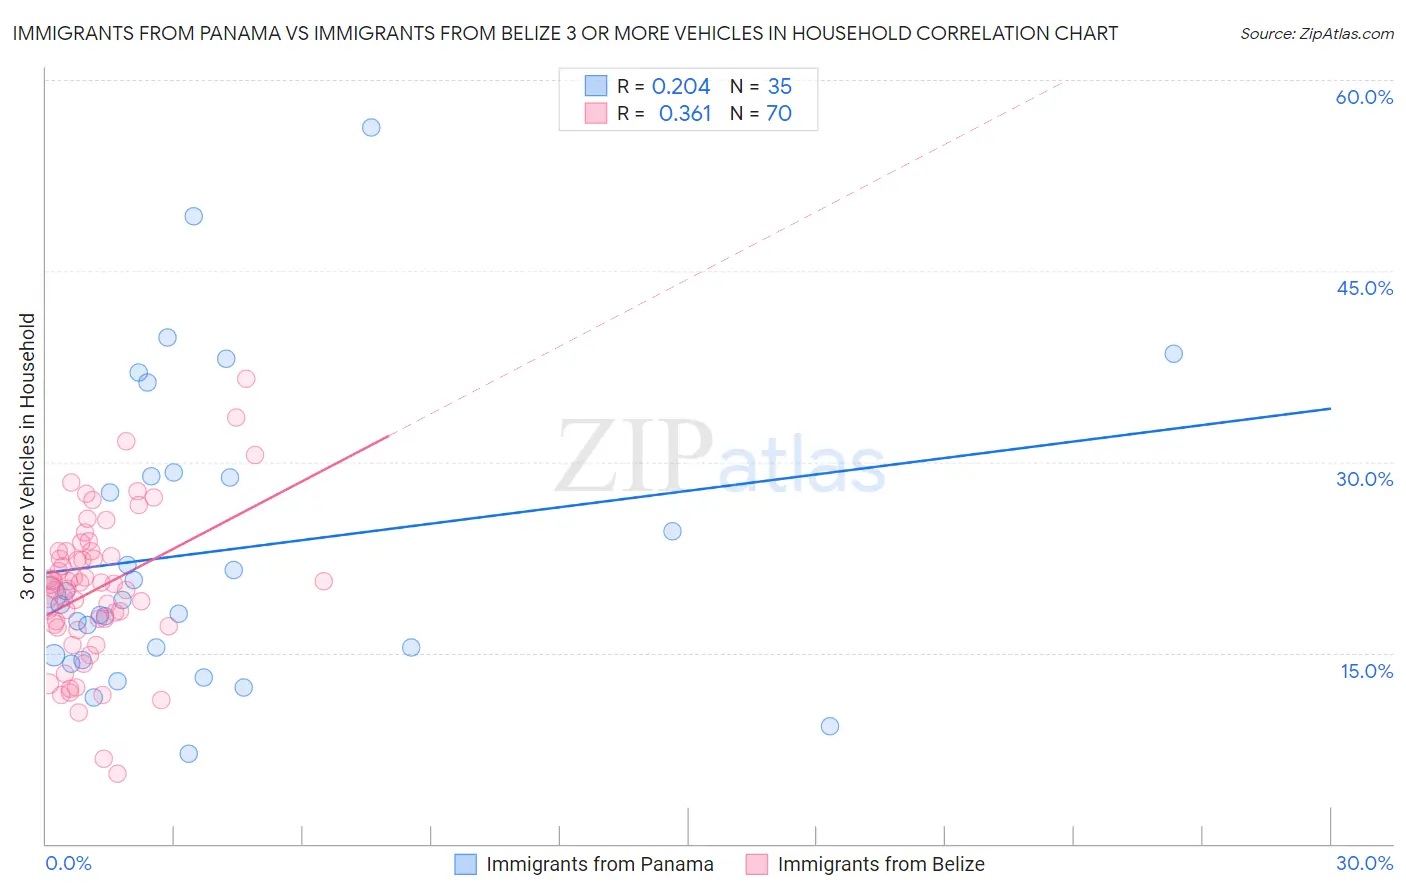
Immigrants from Panama vs Immigrants from Belize 3 or more Vehicles in Household Correlation Chart
The statistical analysis conducted on geographies consisting of 221,149,487 people shows a weak positive correlation between the proportion of Immigrants from Panama and percentage of households with 3 or more vehicles available in the United States with a correlation coefficient (R) of 0.204 and weighted average of 17.7%. Similarly, the statistical analysis conducted on geographies consisting of 130,289,749 people shows a mild positive correlation between the proportion of Immigrants from Belize and percentage of households with 3 or more vehicles available in the United States with a correlation coefficient (R) of 0.361 and weighted average of 18.1%, a difference of 2.0%.
3 or more Vehicles in Household Correlation Summary
| Measurement | Immigrants from Panama | Immigrants from Belize |
| Minimum | 7.1% | 5.5% |
| Maximum | 56.2% | 36.6% |
| Range | 49.1% | 31.1% |
| Mean | 23.0% | 20.0% |
| Median | 19.1% | 20.4% |
| Interquartile 25% (IQ1) | 14.8% | 17.1% |
| Interquartile 75% (IQ3) | 28.9% | 23.0% |
| Interquartile Range (IQR) | 14.1% | 5.9% |
| Standard Deviation (Sample) | 11.5% | 5.8% |
| Standard Deviation (Population) | 11.3% | 5.8% |
Demographics Similar to Immigrants from Panama and Immigrants from Belize by 3 or more Vehicles in Household
In terms of 3 or more vehicles in household, the demographic groups most similar to Immigrants from Panama are Cambodian (17.8%, a difference of 0.14%), Bermudan (17.8%, a difference of 0.16%), Colombian (17.8%, a difference of 0.28%), Immigrants from Northern Africa (17.8%, a difference of 0.30%), and Ugandan (17.8%, a difference of 0.32%). Similarly, the demographic groups most similar to Immigrants from Belize are Immigrants from Australia (18.1%, a difference of 0.070%), Carpatho Rusyn (18.0%, a difference of 0.23%), Immigrants from Eastern Africa (18.0%, a difference of 0.36%), Immigrants from Saudi Arabia (18.0%, a difference of 0.42%), and Venezuelan (18.0%, a difference of 0.44%).
| Demographics | Rating | Rank | 3 or more Vehicles in Household |
| Immigrants | Belize | 2.1 /100 | #245 | Tragic 18.1% |
| Immigrants | Australia | 2.0 /100 | #246 | Tragic 18.1% |
| Carpatho Rusyns | 1.9 /100 | #247 | Tragic 18.0% |
| Immigrants | Eastern Africa | 1.8 /100 | #248 | Tragic 18.0% |
| Immigrants | Saudi Arabia | 1.7 /100 | #249 | Tragic 18.0% |
| Venezuelans | 1.7 /100 | #250 | Tragic 18.0% |
| Alsatians | 1.5 /100 | #251 | Tragic 18.0% |
| Immigrants | Southern Europe | 1.4 /100 | #252 | Tragic 17.9% |
| Immigrants | Ethiopia | 1.3 /100 | #253 | Tragic 17.9% |
| Ethiopians | 1.2 /100 | #254 | Tragic 17.9% |
| Immigrants | Turkey | 1.2 /100 | #255 | Tragic 17.9% |
| Sub-Saharan Africans | 1.1 /100 | #256 | Tragic 17.9% |
| Immigrants | Eritrea | 1.1 /100 | #257 | Tragic 17.8% |
| Sudanese | 1.1 /100 | #258 | Tragic 17.8% |
| Uruguayans | 1.0 /100 | #259 | Tragic 17.8% |
| Ugandans | 0.9 /100 | #260 | Tragic 17.8% |
| Immigrants | Northern Africa | 0.9 /100 | #261 | Tragic 17.8% |
| Colombians | 0.9 /100 | #262 | Tragic 17.8% |
| Bermudans | 0.9 /100 | #263 | Tragic 17.8% |
| Cambodians | 0.9 /100 | #264 | Tragic 17.8% |
| Immigrants | Panama | 0.8 /100 | #265 | Tragic 17.7% |