Immigrants from Panama vs Immigrants from Belize Ambulatory Disability
COMPARE
Immigrants from Panama
Immigrants from Belize
Ambulatory Disability
Ambulatory Disability Comparison
Immigrants from Panama
Immigrants from Belize
6.5%
AMBULATORY DISABILITY
1.5/ 100
METRIC RATING
244th/ 347
METRIC RANK
6.6%
AMBULATORY DISABILITY
0.4/ 100
METRIC RATING
260th/ 347
METRIC RANK
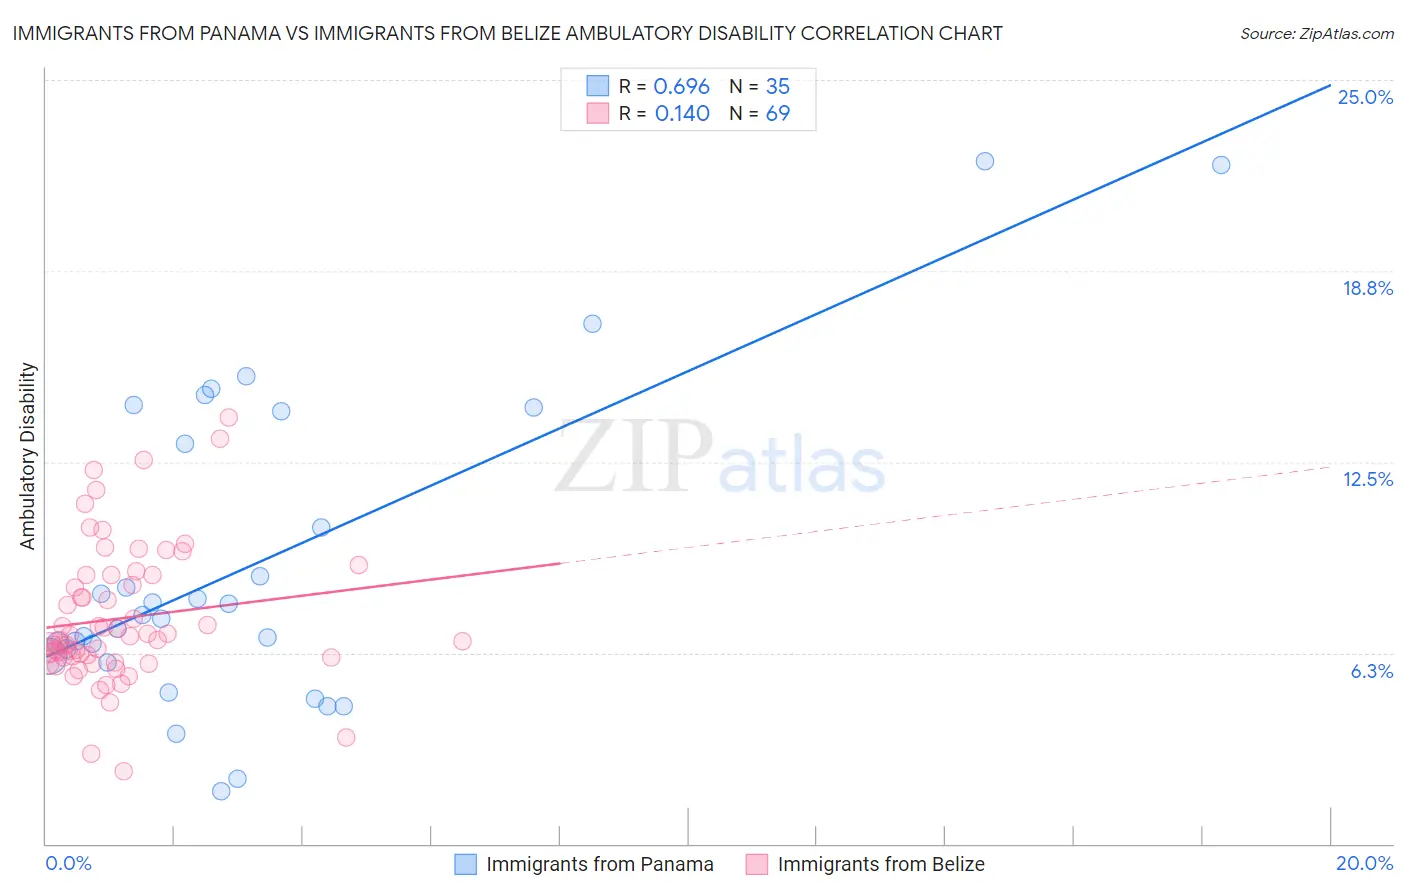
Immigrants from Panama vs Immigrants from Belize Ambulatory Disability Correlation Chart
The statistical analysis conducted on geographies consisting of 221,176,077 people shows a significant positive correlation between the proportion of Immigrants from Panama and percentage of population with ambulatory disability in the United States with a correlation coefficient (R) of 0.696 and weighted average of 6.5%. Similarly, the statistical analysis conducted on geographies consisting of 130,290,767 people shows a poor positive correlation between the proportion of Immigrants from Belize and percentage of population with ambulatory disability in the United States with a correlation coefficient (R) of 0.140 and weighted average of 6.6%, a difference of 1.6%.
Ambulatory Disability Correlation Summary
| Measurement | Immigrants from Panama | Immigrants from Belize |
| Minimum | 1.7% | 2.4% |
| Maximum | 22.3% | 14.0% |
| Range | 20.6% | 11.6% |
| Mean | 9.2% | 7.4% |
| Median | 7.5% | 6.7% |
| Interquartile 25% (IQ1) | 6.1% | 6.1% |
| Interquartile 75% (IQ3) | 14.2% | 8.8% |
| Interquartile Range (IQR) | 8.0% | 2.7% |
| Standard Deviation (Sample) | 5.1% | 2.3% |
| Standard Deviation (Population) | 5.1% | 2.2% |
Demographics Similar to Immigrants from Panama and Immigrants from Belize by Ambulatory Disability
In terms of ambulatory disability, the demographic groups most similar to Immigrants from Panama are German (6.5%, a difference of 0.0%), Spaniard (6.5%, a difference of 0.020%), Tlingit-Haida (6.5%, a difference of 0.030%), Armenian (6.5%, a difference of 0.050%), and Immigrants from Cuba (6.5%, a difference of 0.10%). Similarly, the demographic groups most similar to Immigrants from Belize are Aleut (6.6%, a difference of 0.010%), Irish (6.6%, a difference of 0.070%), Spanish American Indian (6.5%, a difference of 0.19%), English (6.6%, a difference of 0.24%), and Bermudan (6.5%, a difference of 0.27%).
| Demographics | Rating | Rank | Ambulatory Disability |
| Spaniards | 1.6 /100 | #242 | Tragic 6.5% |
| Germans | 1.5 /100 | #243 | Tragic 6.5% |
| Immigrants | Panama | 1.5 /100 | #244 | Tragic 6.5% |
| Tlingit-Haida | 1.5 /100 | #245 | Tragic 6.5% |
| Armenians | 1.5 /100 | #246 | Tragic 6.5% |
| Immigrants | Cuba | 1.4 /100 | #247 | Tragic 6.5% |
| Immigrants | Portugal | 1.4 /100 | #248 | Tragic 6.5% |
| Native Hawaiians | 1.1 /100 | #249 | Tragic 6.5% |
| Chinese | 1.0 /100 | #250 | Tragic 6.5% |
| Hawaiians | 0.9 /100 | #251 | Tragic 6.5% |
| Immigrants | Bahamas | 0.8 /100 | #252 | Tragic 6.5% |
| Scottish | 0.7 /100 | #253 | Tragic 6.5% |
| Belizeans | 0.7 /100 | #254 | Tragic 6.5% |
| Welsh | 0.6 /100 | #255 | Tragic 6.5% |
| Immigrants | Uzbekistan | 0.6 /100 | #256 | Tragic 6.5% |
| Bermudans | 0.5 /100 | #257 | Tragic 6.5% |
| Spanish American Indians | 0.5 /100 | #258 | Tragic 6.5% |
| Aleuts | 0.4 /100 | #259 | Tragic 6.6% |
| Immigrants | Belize | 0.4 /100 | #260 | Tragic 6.6% |
| Irish | 0.4 /100 | #261 | Tragic 6.6% |
| English | 0.4 /100 | #262 | Tragic 6.6% |