Immigrants from Panama vs Immigrants from Belize Unemployment Among Ages 35 to 44 years
COMPARE
Immigrants from Panama
Immigrants from Belize
Unemployment Among Ages 35 to 44 years
Unemployment Among Ages 35 to 44 years Comparison
Immigrants from Panama
Immigrants from Belize
5.0%
UNEMPLOYMENT AMONG AGES 35 TO 44 YEARS
3.3/ 100
METRIC RATING
223rd/ 347
METRIC RANK
5.8%
UNEMPLOYMENT AMONG AGES 35 TO 44 YEARS
0.0/ 100
METRIC RATING
307th/ 347
METRIC RANK
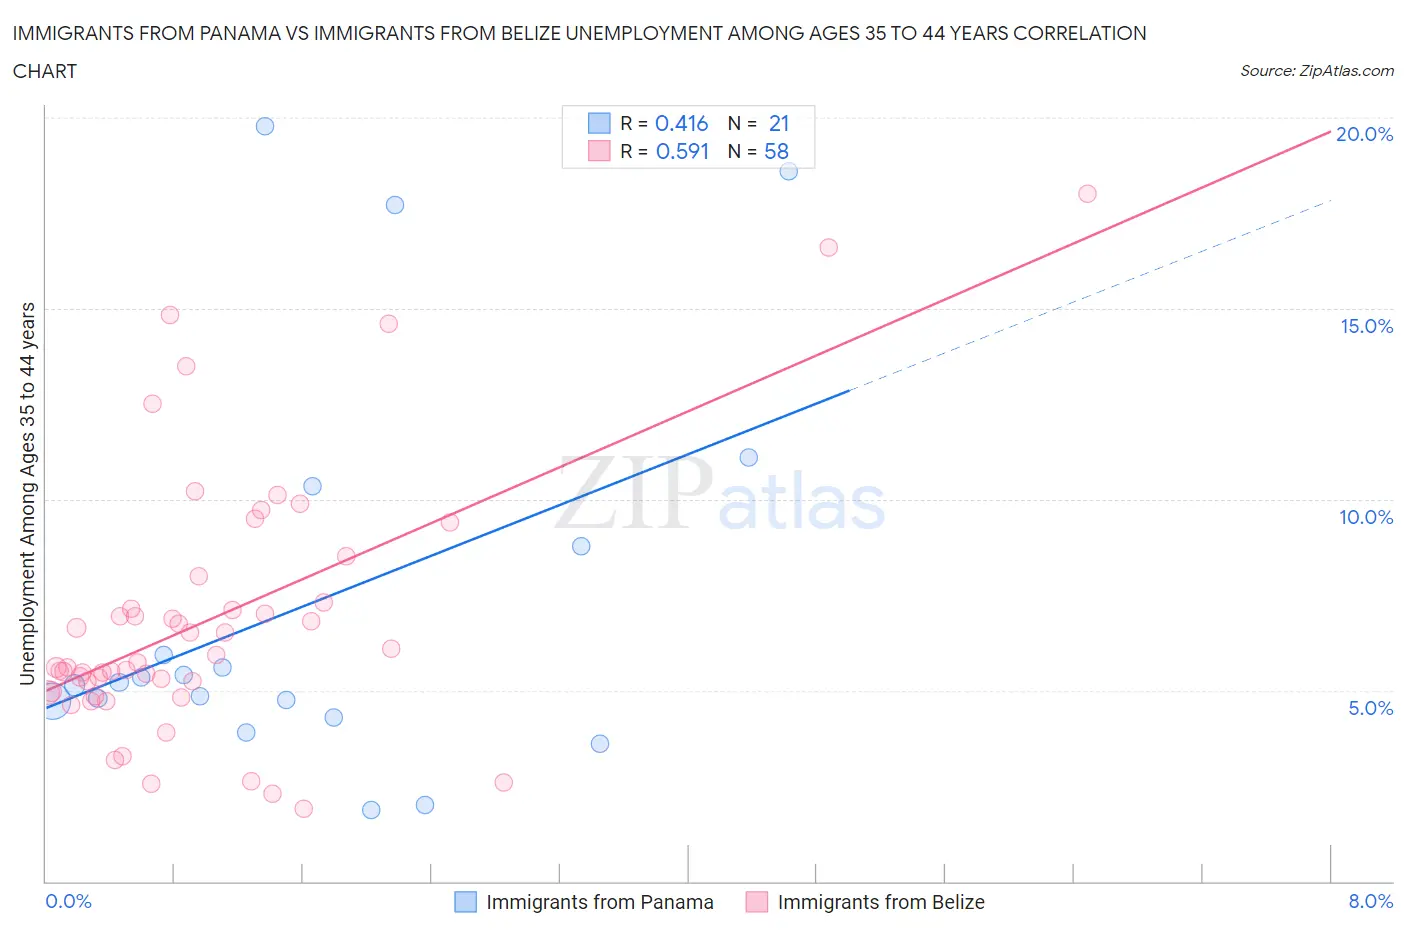
Immigrants from Panama vs Immigrants from Belize Unemployment Among Ages 35 to 44 years Correlation Chart
The statistical analysis conducted on geographies consisting of 219,440,273 people shows a moderate positive correlation between the proportion of Immigrants from Panama and unemployment rate among population between the ages 35 and 44 in the United States with a correlation coefficient (R) of 0.416 and weighted average of 5.0%. Similarly, the statistical analysis conducted on geographies consisting of 129,762,565 people shows a substantial positive correlation between the proportion of Immigrants from Belize and unemployment rate among population between the ages 35 and 44 in the United States with a correlation coefficient (R) of 0.591 and weighted average of 5.8%, a difference of 15.9%.
Unemployment Among Ages 35 to 44 years Correlation Summary
| Measurement | Immigrants from Panama | Immigrants from Belize |
| Minimum | 1.9% | 1.9% |
| Maximum | 19.8% | 18.0% |
| Range | 17.9% | 16.1% |
| Mean | 7.3% | 6.9% |
| Median | 5.2% | 5.7% |
| Interquartile 25% (IQ1) | 4.5% | 5.0% |
| Interquartile 75% (IQ3) | 9.6% | 7.3% |
| Interquartile Range (IQR) | 5.1% | 2.3% |
| Standard Deviation (Sample) | 5.3% | 3.4% |
| Standard Deviation (Population) | 5.1% | 3.4% |
Similar Demographics by Unemployment Among Ages 35 to 44 years
Demographics Similar to Immigrants from Panama by Unemployment Among Ages 35 to 44 years
In terms of unemployment among ages 35 to 44 years, the demographic groups most similar to Immigrants from Panama are Hmong (5.0%, a difference of 0.080%), Panamanian (5.0%, a difference of 0.23%), Bermudan (5.0%, a difference of 0.27%), Immigrants from Lebanon (5.0%, a difference of 0.35%), and Potawatomi (5.0%, a difference of 0.46%).
| Demographics | Rating | Rank | Unemployment Among Ages 35 to 44 years |
| Americans | 6.2 /100 | #216 | Tragic 4.9% |
| Moroccans | 6.0 /100 | #217 | Tragic 4.9% |
| Chickasaw | 5.7 /100 | #218 | Tragic 4.9% |
| Sierra Leoneans | 4.8 /100 | #219 | Tragic 4.9% |
| Immigrants | Sierra Leone | 4.7 /100 | #220 | Tragic 4.9% |
| Bermudans | 3.9 /100 | #221 | Tragic 5.0% |
| Hmong | 3.5 /100 | #222 | Tragic 5.0% |
| Immigrants | Panama | 3.3 /100 | #223 | Tragic 5.0% |
| Panamanians | 2.9 /100 | #224 | Tragic 5.0% |
| Immigrants | Lebanon | 2.7 /100 | #225 | Tragic 5.0% |
| Potawatomi | 2.5 /100 | #226 | Tragic 5.0% |
| Immigrants | Uzbekistan | 1.9 /100 | #227 | Tragic 5.0% |
| Samoans | 1.8 /100 | #228 | Tragic 5.0% |
| Immigrants | Cambodia | 1.5 /100 | #229 | Tragic 5.0% |
| Liberians | 1.3 /100 | #230 | Tragic 5.1% |
Demographics Similar to Immigrants from Belize by Unemployment Among Ages 35 to 44 years
In terms of unemployment among ages 35 to 44 years, the demographic groups most similar to Immigrants from Belize are Immigrants from the Azores (5.8%, a difference of 0.28%), Barbadian (5.7%, a difference of 0.54%), Immigrants from Barbados (5.8%, a difference of 0.57%), Belizean (5.7%, a difference of 1.7%), and West Indian (5.7%, a difference of 1.9%).
| Demographics | Rating | Rank | Unemployment Among Ages 35 to 44 years |
| Immigrants | West Indies | 0.0 /100 | #300 | Tragic 5.6% |
| Africans | 0.0 /100 | #301 | Tragic 5.6% |
| Nepalese | 0.0 /100 | #302 | Tragic 5.6% |
| Yakama | 0.0 /100 | #303 | Tragic 5.6% |
| West Indians | 0.0 /100 | #304 | Tragic 5.7% |
| Belizeans | 0.0 /100 | #305 | Tragic 5.7% |
| Barbadians | 0.0 /100 | #306 | Tragic 5.7% |
| Immigrants | Belize | 0.0 /100 | #307 | Tragic 5.8% |
| Immigrants | Azores | 0.0 /100 | #308 | Tragic 5.8% |
| Immigrants | Barbados | 0.0 /100 | #309 | Tragic 5.8% |
| Guyanese | 0.0 /100 | #310 | Tragic 5.9% |
| Marshallese | 0.0 /100 | #311 | Tragic 5.9% |
| Immigrants | Guyana | 0.0 /100 | #312 | Tragic 6.0% |
| British West Indians | 0.0 /100 | #313 | Tragic 6.0% |
| Immigrants | Dominica | 0.0 /100 | #314 | Tragic 6.0% |