Immigrants from Panama vs Cree Male Disability
COMPARE
Immigrants from Panama
Cree
Male Disability
Male Disability Comparison
Immigrants from Panama
Cree
11.5%
MALE DISABILITY
13.0/ 100
METRIC RATING
201st/ 347
METRIC RANK
13.7%
MALE DISABILITY
0.0/ 100
METRIC RATING
318th/ 347
METRIC RANK
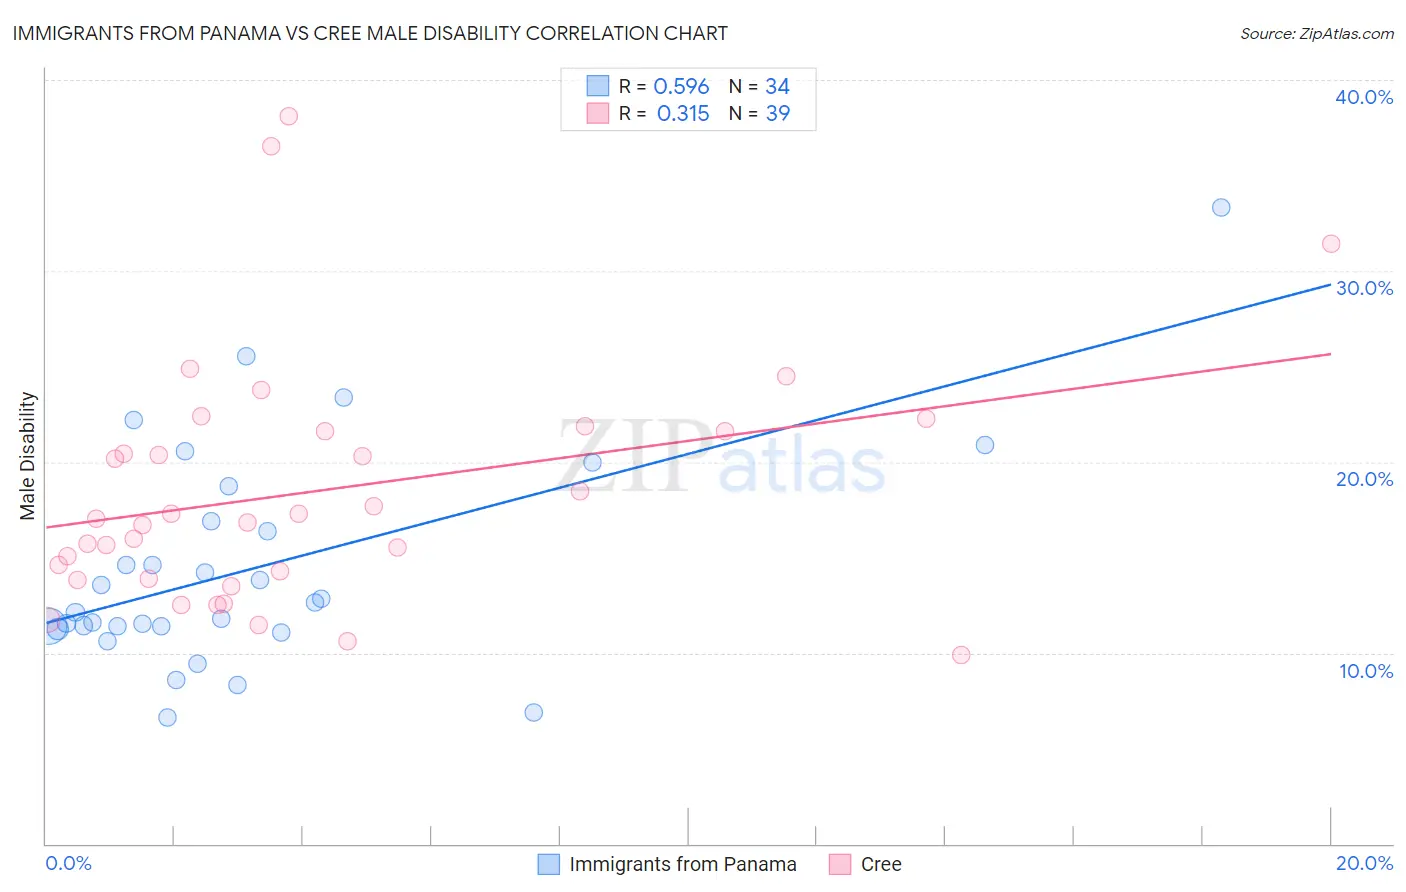
Immigrants from Panama vs Cree Male Disability Correlation Chart
The statistical analysis conducted on geographies consisting of 221,177,932 people shows a substantial positive correlation between the proportion of Immigrants from Panama and percentage of males with a disability in the United States with a correlation coefficient (R) of 0.596 and weighted average of 11.5%. Similarly, the statistical analysis conducted on geographies consisting of 76,208,606 people shows a mild positive correlation between the proportion of Cree and percentage of males with a disability in the United States with a correlation coefficient (R) of 0.315 and weighted average of 13.7%, a difference of 19.1%.
Male Disability Correlation Summary
| Measurement | Immigrants from Panama | Cree |
| Minimum | 6.6% | 9.9% |
| Maximum | 33.3% | 38.1% |
| Range | 26.7% | 28.2% |
| Mean | 14.4% | 18.5% |
| Median | 12.4% | 17.0% |
| Interquartile 25% (IQ1) | 11.4% | 13.9% |
| Interquartile 75% (IQ3) | 16.9% | 21.6% |
| Interquartile Range (IQR) | 5.5% | 7.7% |
| Standard Deviation (Sample) | 5.7% | 6.4% |
| Standard Deviation (Population) | 5.7% | 6.3% |
Similar Demographics by Male Disability
Demographics Similar to Immigrants from Panama by Male Disability
In terms of male disability, the demographic groups most similar to Immigrants from Panama are Immigrants from Iraq (11.5%, a difference of 0.0%), Immigrants from Mexico (11.5%, a difference of 0.040%), Lebanese (11.5%, a difference of 0.27%), Jamaican (11.5%, a difference of 0.27%), and Immigrants from Cambodia (11.5%, a difference of 0.29%).
| Demographics | Rating | Rank | Male Disability |
| Belizeans | 21.2 /100 | #194 | Fair 11.4% |
| Immigrants | Oceania | 20.9 /100 | #195 | Fair 11.4% |
| West Indians | 18.4 /100 | #196 | Poor 11.4% |
| Somalis | 18.2 /100 | #197 | Poor 11.4% |
| Immigrants | Jamaica | 16.3 /100 | #198 | Poor 11.5% |
| Lebanese | 15.4 /100 | #199 | Poor 11.5% |
| Immigrants | Iraq | 13.0 /100 | #200 | Poor 11.5% |
| Immigrants | Panama | 13.0 /100 | #201 | Poor 11.5% |
| Immigrants | Mexico | 12.6 /100 | #202 | Poor 11.5% |
| Jamaicans | 10.9 /100 | #203 | Poor 11.5% |
| Immigrants | Cambodia | 10.8 /100 | #204 | Poor 11.5% |
| Serbians | 10.7 /100 | #205 | Poor 11.5% |
| Ukrainians | 10.6 /100 | #206 | Poor 11.5% |
| Immigrants | Somalia | 10.4 /100 | #207 | Poor 11.5% |
| Icelanders | 10.1 /100 | #208 | Poor 11.6% |
Demographics Similar to Cree by Male Disability
In terms of male disability, the demographic groups most similar to Cree are Paiute (13.7%, a difference of 0.21%), American (13.8%, a difference of 0.41%), Tlingit-Haida (13.8%, a difference of 0.90%), Shoshone (13.8%, a difference of 0.96%), and Alaska Native (13.6%, a difference of 1.0%).
| Demographics | Rating | Rank | Male Disability |
| Delaware | 0.0 /100 | #311 | Tragic 13.5% |
| Yakama | 0.0 /100 | #312 | Tragic 13.5% |
| Puget Sound Salish | 0.0 /100 | #313 | Tragic 13.5% |
| Aleuts | 0.0 /100 | #314 | Tragic 13.5% |
| Iroquois | 0.0 /100 | #315 | Tragic 13.6% |
| Alaska Natives | 0.0 /100 | #316 | Tragic 13.6% |
| Paiute | 0.0 /100 | #317 | Tragic 13.7% |
| Cree | 0.0 /100 | #318 | Tragic 13.7% |
| Americans | 0.0 /100 | #319 | Tragic 13.8% |
| Tlingit-Haida | 0.0 /100 | #320 | Tragic 13.8% |
| Shoshone | 0.0 /100 | #321 | Tragic 13.8% |
| Apache | 0.0 /100 | #322 | Tragic 14.0% |
| Osage | 0.0 /100 | #323 | Tragic 14.0% |
| Comanche | 0.0 /100 | #324 | Tragic 14.1% |
| Ottawa | 0.0 /100 | #325 | Tragic 14.1% |