Immigrants from Oceania vs Syrian Vision Disability
COMPARE
Immigrants from Oceania
Syrian
Vision Disability
Vision Disability Comparison
Immigrants from Oceania
Syrians
2.2%
VISION DISABILITY
45.1/ 100
METRIC RATING
178th/ 347
METRIC RANK
2.1%
VISION DISABILITY
87.5/ 100
METRIC RATING
133rd/ 347
METRIC RANK
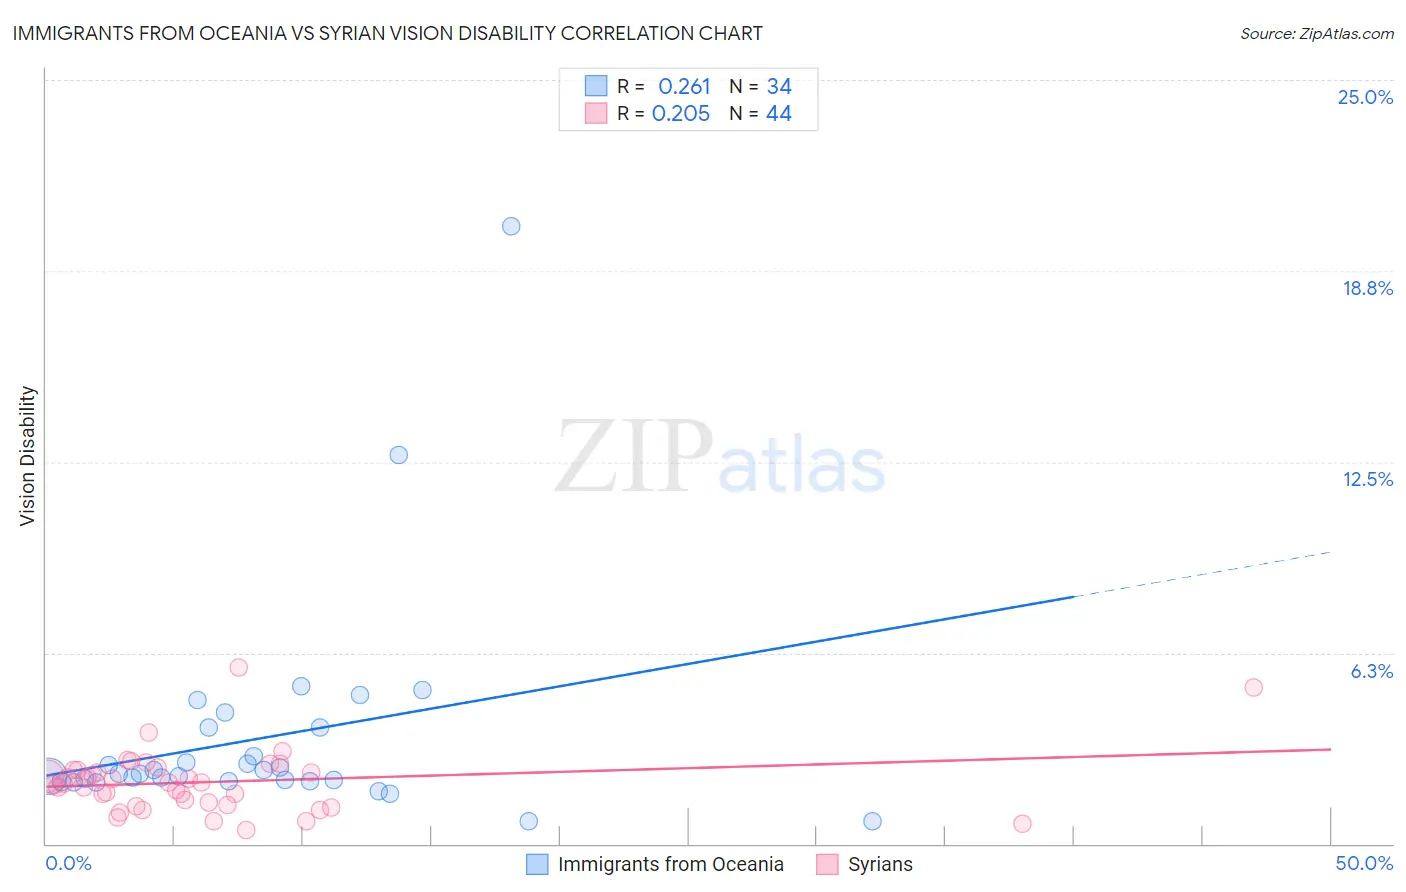
Immigrants from Oceania vs Syrian Vision Disability Correlation Chart
The statistical analysis conducted on geographies consisting of 305,325,142 people shows a weak positive correlation between the proportion of Immigrants from Oceania and percentage of population with vision disability in the United States with a correlation coefficient (R) of 0.261 and weighted average of 2.2%. Similarly, the statistical analysis conducted on geographies consisting of 266,224,532 people shows a weak positive correlation between the proportion of Syrians and percentage of population with vision disability in the United States with a correlation coefficient (R) of 0.205 and weighted average of 2.1%, a difference of 3.5%.
Vision Disability Correlation Summary
| Measurement | Immigrants from Oceania | Syrian |
| Minimum | 0.72% | 0.46% |
| Maximum | 20.2% | 5.8% |
| Range | 19.5% | 5.3% |
| Mean | 3.5% | 2.0% |
| Median | 2.3% | 2.0% |
| Interquartile 25% (IQ1) | 2.1% | 1.3% |
| Interquartile 75% (IQ3) | 3.8% | 2.4% |
| Interquartile Range (IQR) | 1.7% | 1.1% |
| Standard Deviation (Sample) | 3.6% | 1.0% |
| Standard Deviation (Population) | 3.5% | 1.0% |
Similar Demographics by Vision Disability
Demographics Similar to Immigrants from Oceania by Vision Disability
In terms of vision disability, the demographic groups most similar to Immigrants from Oceania are Immigrants from North America (2.2%, a difference of 0.040%), Slavic (2.2%, a difference of 0.050%), Yugoslavian (2.2%, a difference of 0.090%), Immigrants from Fiji (2.2%, a difference of 0.16%), and Uruguayan (2.2%, a difference of 0.16%).
| Demographics | Rating | Rank | Vision Disability |
| Lebanese | 54.3 /100 | #171 | Average 2.2% |
| Northern Europeans | 50.1 /100 | #172 | Average 2.2% |
| Scandinavians | 50.0 /100 | #173 | Average 2.2% |
| Immigrants | Canada | 50.0 /100 | #174 | Average 2.2% |
| Immigrants | Fiji | 47.6 /100 | #175 | Average 2.2% |
| Yugoslavians | 46.5 /100 | #176 | Average 2.2% |
| Slavs | 46.0 /100 | #177 | Average 2.2% |
| Immigrants | Oceania | 45.1 /100 | #178 | Average 2.2% |
| Immigrants | North America | 44.5 /100 | #179 | Average 2.2% |
| Uruguayans | 42.7 /100 | #180 | Average 2.2% |
| Immigrants | Western Europe | 41.1 /100 | #181 | Average 2.2% |
| Costa Ricans | 40.7 /100 | #182 | Average 2.2% |
| Immigrants | Burma/Myanmar | 37.9 /100 | #183 | Fair 2.2% |
| Moroccans | 35.4 /100 | #184 | Fair 2.2% |
| Immigrants | Middle Africa | 33.5 /100 | #185 | Fair 2.2% |
Demographics Similar to Syrians by Vision Disability
In terms of vision disability, the demographic groups most similar to Syrians are Venezuelan (2.1%, a difference of 0.050%), New Zealander (2.1%, a difference of 0.10%), Vietnamese (2.1%, a difference of 0.12%), Immigrants from Hungary (2.1%, a difference of 0.17%), and Czech (2.1%, a difference of 0.17%).
| Demographics | Rating | Rank | Vision Disability |
| Immigrants | Peru | 89.5 /100 | #126 | Excellent 2.1% |
| Sudanese | 89.2 /100 | #127 | Excellent 2.1% |
| Immigrants | Chile | 89.0 /100 | #128 | Excellent 2.1% |
| Immigrants | Cameroon | 88.8 /100 | #129 | Excellent 2.1% |
| Immigrants | Kenya | 88.7 /100 | #130 | Excellent 2.1% |
| Immigrants | Hungary | 88.7 /100 | #131 | Excellent 2.1% |
| New Zealanders | 88.2 /100 | #132 | Excellent 2.1% |
| Syrians | 87.5 /100 | #133 | Excellent 2.1% |
| Venezuelans | 87.2 /100 | #134 | Excellent 2.1% |
| Vietnamese | 86.7 /100 | #135 | Excellent 2.1% |
| Czechs | 86.3 /100 | #136 | Excellent 2.1% |
| Immigrants | South Eastern Asia | 86.3 /100 | #137 | Excellent 2.1% |
| Arabs | 86.3 /100 | #138 | Excellent 2.1% |
| Immigrants | Morocco | 85.2 /100 | #139 | Excellent 2.1% |
| Immigrants | Netherlands | 84.2 /100 | #140 | Excellent 2.1% |