Immigrants from Oceania vs Arapaho Vision Disability
COMPARE
Immigrants from Oceania
Arapaho
Vision Disability
Vision Disability Comparison
Immigrants from Oceania
Arapaho
2.2%
VISION DISABILITY
45.1/ 100
METRIC RATING
178th/ 347
METRIC RANK
2.6%
VISION DISABILITY
0.0/ 100
METRIC RATING
308th/ 347
METRIC RANK
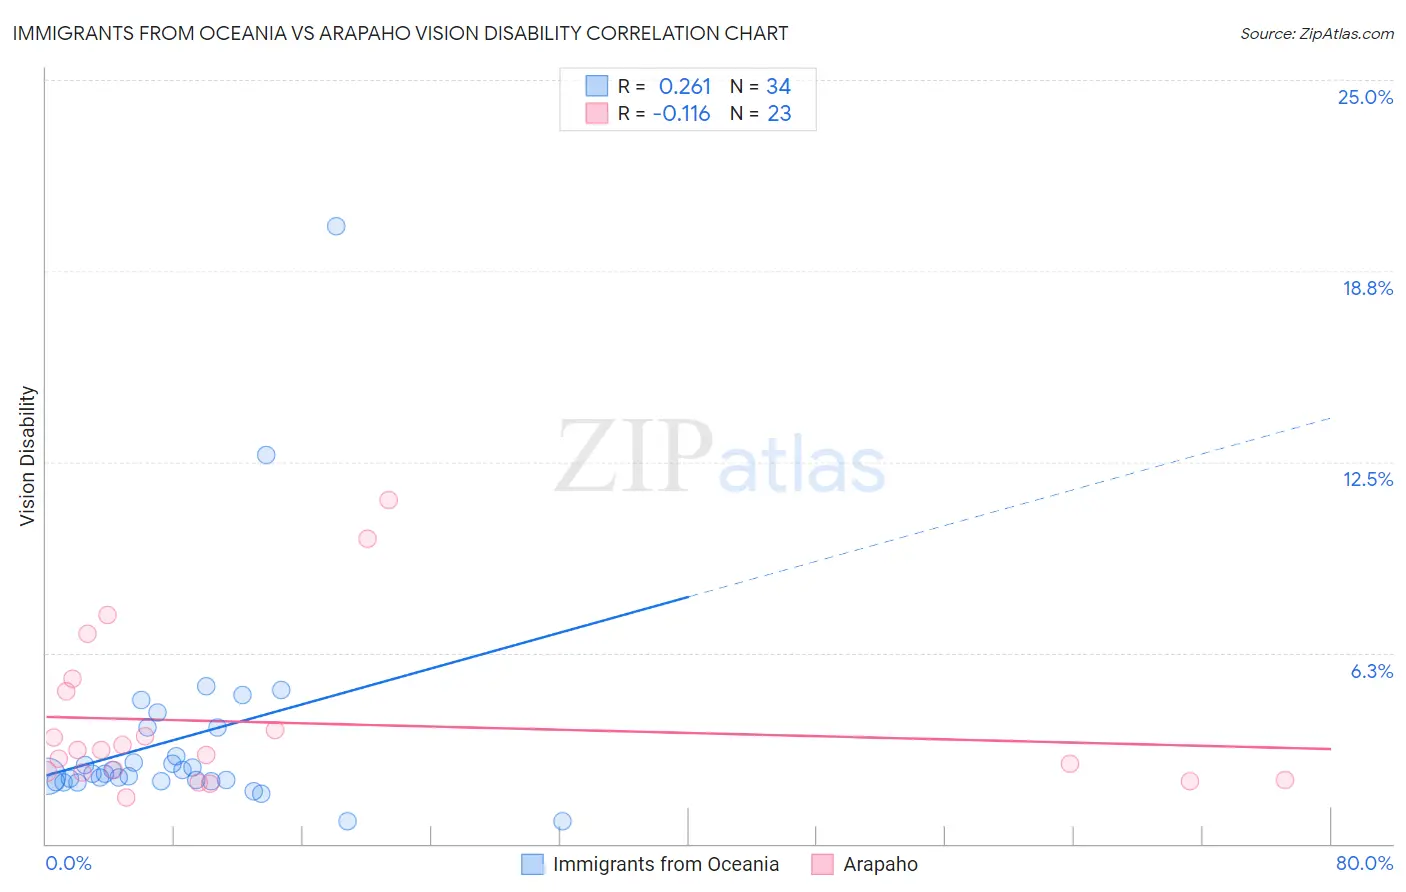
Immigrants from Oceania vs Arapaho Vision Disability Correlation Chart
The statistical analysis conducted on geographies consisting of 305,325,142 people shows a weak positive correlation between the proportion of Immigrants from Oceania and percentage of population with vision disability in the United States with a correlation coefficient (R) of 0.261 and weighted average of 2.2%. Similarly, the statistical analysis conducted on geographies consisting of 29,770,133 people shows a poor negative correlation between the proportion of Arapaho and percentage of population with vision disability in the United States with a correlation coefficient (R) of -0.116 and weighted average of 2.6%, a difference of 20.1%.
Vision Disability Correlation Summary
| Measurement | Immigrants from Oceania | Arapaho |
| Minimum | 0.72% | 1.5% |
| Maximum | 20.2% | 11.2% |
| Range | 19.5% | 9.7% |
| Mean | 3.5% | 4.0% |
| Median | 2.3% | 3.1% |
| Interquartile 25% (IQ1) | 2.1% | 2.3% |
| Interquartile 75% (IQ3) | 3.8% | 5.0% |
| Interquartile Range (IQR) | 1.7% | 2.7% |
| Standard Deviation (Sample) | 3.6% | 2.6% |
| Standard Deviation (Population) | 3.5% | 2.5% |
Similar Demographics by Vision Disability
Demographics Similar to Immigrants from Oceania by Vision Disability
In terms of vision disability, the demographic groups most similar to Immigrants from Oceania are Immigrants from North America (2.2%, a difference of 0.040%), Slavic (2.2%, a difference of 0.050%), Yugoslavian (2.2%, a difference of 0.090%), Immigrants from Fiji (2.2%, a difference of 0.16%), and Uruguayan (2.2%, a difference of 0.16%).
| Demographics | Rating | Rank | Vision Disability |
| Lebanese | 54.3 /100 | #171 | Average 2.2% |
| Northern Europeans | 50.1 /100 | #172 | Average 2.2% |
| Scandinavians | 50.0 /100 | #173 | Average 2.2% |
| Immigrants | Canada | 50.0 /100 | #174 | Average 2.2% |
| Immigrants | Fiji | 47.6 /100 | #175 | Average 2.2% |
| Yugoslavians | 46.5 /100 | #176 | Average 2.2% |
| Slavs | 46.0 /100 | #177 | Average 2.2% |
| Immigrants | Oceania | 45.1 /100 | #178 | Average 2.2% |
| Immigrants | North America | 44.5 /100 | #179 | Average 2.2% |
| Uruguayans | 42.7 /100 | #180 | Average 2.2% |
| Immigrants | Western Europe | 41.1 /100 | #181 | Average 2.2% |
| Costa Ricans | 40.7 /100 | #182 | Average 2.2% |
| Immigrants | Burma/Myanmar | 37.9 /100 | #183 | Fair 2.2% |
| Moroccans | 35.4 /100 | #184 | Fair 2.2% |
| Immigrants | Middle Africa | 33.5 /100 | #185 | Fair 2.2% |
Demographics Similar to Arapaho by Vision Disability
In terms of vision disability, the demographic groups most similar to Arapaho are Immigrants from Dominican Republic (2.6%, a difference of 0.020%), Iroquois (2.6%, a difference of 0.040%), Immigrants from Yemen (2.6%, a difference of 0.29%), Blackfeet (2.6%, a difference of 0.61%), and Hispanic or Latino (2.6%, a difference of 0.65%).
| Demographics | Rating | Rank | Vision Disability |
| Menominee | 0.0 /100 | #301 | Tragic 2.5% |
| Spanish American Indians | 0.0 /100 | #302 | Tragic 2.6% |
| Immigrants | Cabo Verde | 0.0 /100 | #303 | Tragic 2.6% |
| Aleuts | 0.0 /100 | #304 | Tragic 2.6% |
| Hispanics or Latinos | 0.0 /100 | #305 | Tragic 2.6% |
| Iroquois | 0.0 /100 | #306 | Tragic 2.6% |
| Immigrants | Dominican Republic | 0.0 /100 | #307 | Tragic 2.6% |
| Arapaho | 0.0 /100 | #308 | Tragic 2.6% |
| Immigrants | Yemen | 0.0 /100 | #309 | Tragic 2.6% |
| Blackfeet | 0.0 /100 | #310 | Tragic 2.6% |
| Dominicans | 0.0 /100 | #311 | Tragic 2.6% |
| Americans | 0.0 /100 | #312 | Tragic 2.6% |
| Potawatomi | 0.0 /100 | #313 | Tragic 2.6% |
| Inupiat | 0.0 /100 | #314 | Tragic 2.7% |
| Osage | 0.0 /100 | #315 | Tragic 2.7% |