Turkish vs Syrian Vision Disability
COMPARE
Turkish
Syrian
Vision Disability
Vision Disability Comparison
Turks
Syrians
1.9%
VISION DISABILITY
100.0/ 100
METRIC RATING
21st/ 347
METRIC RANK
2.1%
VISION DISABILITY
87.5/ 100
METRIC RATING
133rd/ 347
METRIC RANK
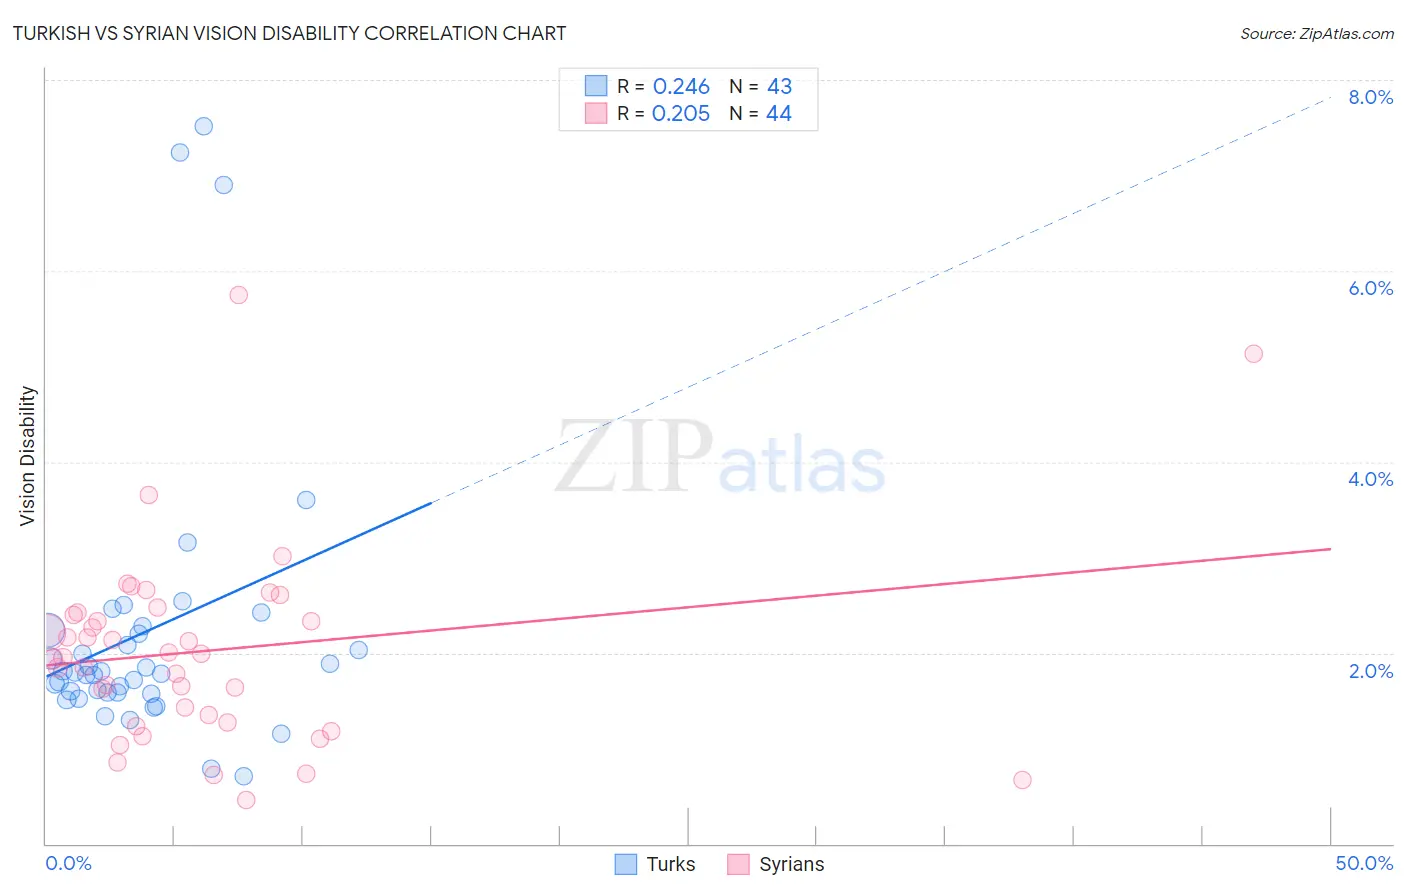
Turkish vs Syrian Vision Disability Correlation Chart
The statistical analysis conducted on geographies consisting of 271,748,480 people shows a weak positive correlation between the proportion of Turks and percentage of population with vision disability in the United States with a correlation coefficient (R) of 0.246 and weighted average of 1.9%. Similarly, the statistical analysis conducted on geographies consisting of 266,224,532 people shows a weak positive correlation between the proportion of Syrians and percentage of population with vision disability in the United States with a correlation coefficient (R) of 0.205 and weighted average of 2.1%, a difference of 10.2%.
Vision Disability Correlation Summary
| Measurement | Turkish | Syrian |
| Minimum | 0.70% | 0.46% |
| Maximum | 7.5% | 5.8% |
| Range | 6.8% | 5.3% |
| Mean | 2.2% | 2.0% |
| Median | 1.8% | 2.0% |
| Interquartile 25% (IQ1) | 1.6% | 1.3% |
| Interquartile 75% (IQ3) | 2.2% | 2.4% |
| Interquartile Range (IQR) | 0.65% | 1.1% |
| Standard Deviation (Sample) | 1.5% | 1.0% |
| Standard Deviation (Population) | 1.5% | 1.0% |
Similar Demographics by Vision Disability
Demographics Similar to Turks by Vision Disability
In terms of vision disability, the demographic groups most similar to Turks are Immigrants from Pakistan (1.9%, a difference of 0.050%), Asian (1.9%, a difference of 0.31%), Immigrants from Asia (1.9%, a difference of 0.59%), Immigrants from Lithuania (1.9%, a difference of 0.71%), and Bulgarian (1.9%, a difference of 0.75%).
| Demographics | Rating | Rank | Vision Disability |
| Immigrants | China | 100.0 /100 | #14 | Exceptional 1.8% |
| Immigrants | Bolivia | 100.0 /100 | #15 | Exceptional 1.8% |
| Indians (Asian) | 100.0 /100 | #16 | Exceptional 1.8% |
| Burmese | 100.0 /100 | #17 | Exceptional 1.8% |
| Bolivians | 100.0 /100 | #18 | Exceptional 1.9% |
| Immigrants | Sri Lanka | 100.0 /100 | #19 | Exceptional 1.9% |
| Asians | 100.0 /100 | #20 | Exceptional 1.9% |
| Turks | 100.0 /100 | #21 | Exceptional 1.9% |
| Immigrants | Pakistan | 100.0 /100 | #22 | Exceptional 1.9% |
| Immigrants | Asia | 99.9 /100 | #23 | Exceptional 1.9% |
| Immigrants | Lithuania | 99.9 /100 | #24 | Exceptional 1.9% |
| Bulgarians | 99.9 /100 | #25 | Exceptional 1.9% |
| Immigrants | Japan | 99.9 /100 | #26 | Exceptional 1.9% |
| Taiwanese | 99.9 /100 | #27 | Exceptional 1.9% |
| Immigrants | Malaysia | 99.9 /100 | #28 | Exceptional 1.9% |
Demographics Similar to Syrians by Vision Disability
In terms of vision disability, the demographic groups most similar to Syrians are Venezuelan (2.1%, a difference of 0.050%), New Zealander (2.1%, a difference of 0.10%), Vietnamese (2.1%, a difference of 0.12%), Immigrants from Hungary (2.1%, a difference of 0.17%), and Czech (2.1%, a difference of 0.17%).
| Demographics | Rating | Rank | Vision Disability |
| Immigrants | Peru | 89.5 /100 | #126 | Excellent 2.1% |
| Sudanese | 89.2 /100 | #127 | Excellent 2.1% |
| Immigrants | Chile | 89.0 /100 | #128 | Excellent 2.1% |
| Immigrants | Cameroon | 88.8 /100 | #129 | Excellent 2.1% |
| Immigrants | Kenya | 88.7 /100 | #130 | Excellent 2.1% |
| Immigrants | Hungary | 88.7 /100 | #131 | Excellent 2.1% |
| New Zealanders | 88.2 /100 | #132 | Excellent 2.1% |
| Syrians | 87.5 /100 | #133 | Excellent 2.1% |
| Venezuelans | 87.2 /100 | #134 | Excellent 2.1% |
| Vietnamese | 86.7 /100 | #135 | Excellent 2.1% |
| Czechs | 86.3 /100 | #136 | Excellent 2.1% |
| Immigrants | South Eastern Asia | 86.3 /100 | #137 | Excellent 2.1% |
| Arabs | 86.3 /100 | #138 | Excellent 2.1% |
| Immigrants | Morocco | 85.2 /100 | #139 | Excellent 2.1% |
| Immigrants | Netherlands | 84.2 /100 | #140 | Excellent 2.1% |