Immigrants from Oceania vs Immigrants from Grenada Vision Disability
COMPARE
Immigrants from Oceania
Immigrants from Grenada
Vision Disability
Vision Disability Comparison
Immigrants from Oceania
Immigrants from Grenada
2.2%
VISION DISABILITY
45.1/ 100
METRIC RATING
178th/ 347
METRIC RANK
2.2%
VISION DISABILITY
23.1/ 100
METRIC RATING
196th/ 347
METRIC RANK
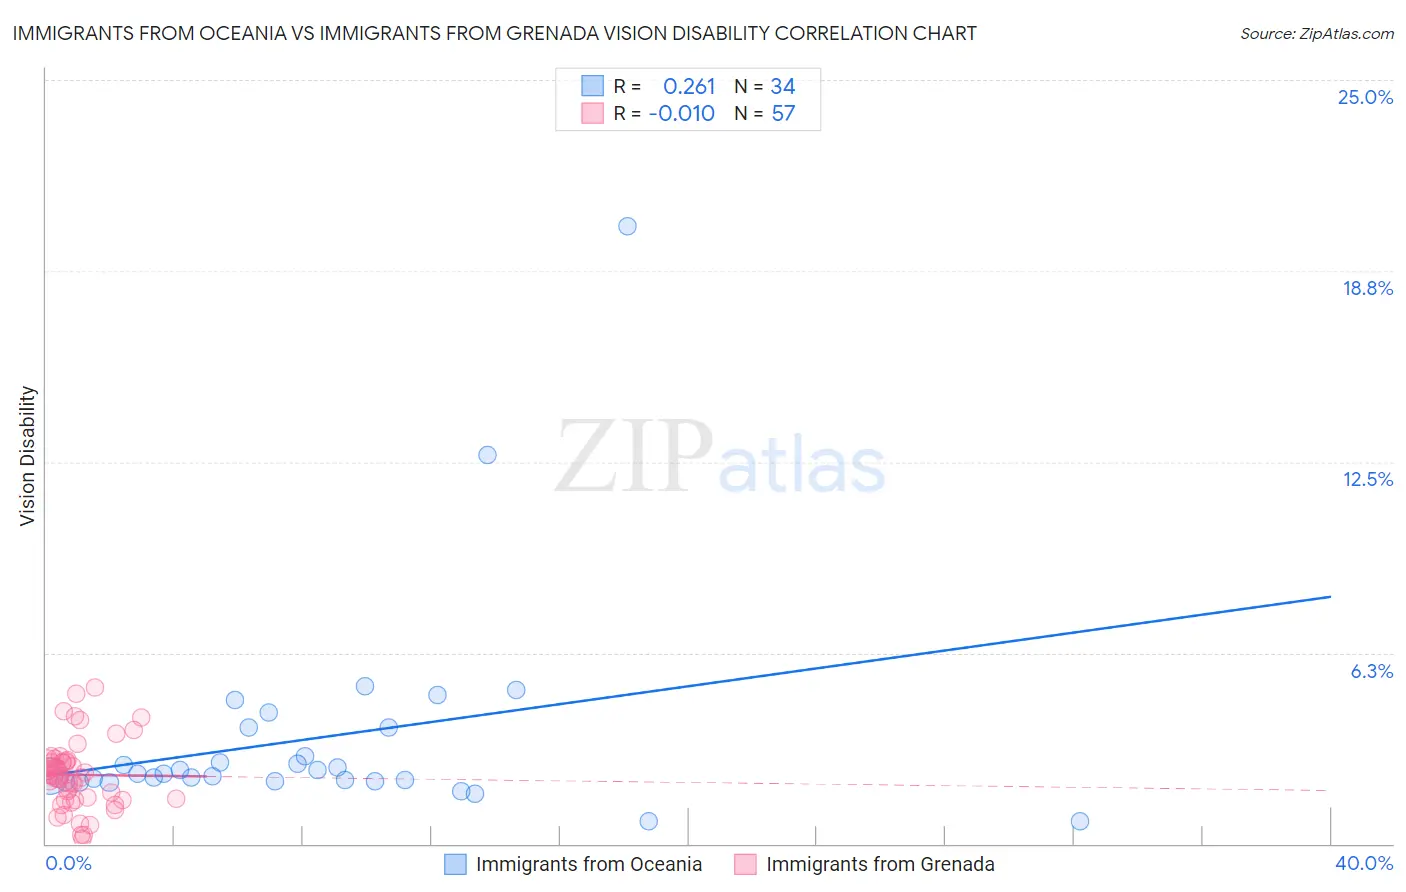
Immigrants from Oceania vs Immigrants from Grenada Vision Disability Correlation Chart
The statistical analysis conducted on geographies consisting of 305,325,142 people shows a weak positive correlation between the proportion of Immigrants from Oceania and percentage of population with vision disability in the United States with a correlation coefficient (R) of 0.261 and weighted average of 2.2%. Similarly, the statistical analysis conducted on geographies consisting of 67,180,438 people shows no correlation between the proportion of Immigrants from Grenada and percentage of population with vision disability in the United States with a correlation coefficient (R) of -0.010 and weighted average of 2.2%, a difference of 1.6%.
Vision Disability Correlation Summary
| Measurement | Immigrants from Oceania | Immigrants from Grenada |
| Minimum | 0.72% | 0.16% |
| Maximum | 20.2% | 5.1% |
| Range | 19.5% | 4.9% |
| Mean | 3.5% | 2.3% |
| Median | 2.3% | 2.2% |
| Interquartile 25% (IQ1) | 2.1% | 1.4% |
| Interquartile 75% (IQ3) | 3.8% | 2.7% |
| Interquartile Range (IQR) | 1.7% | 1.3% |
| Standard Deviation (Sample) | 3.6% | 1.1% |
| Standard Deviation (Population) | 3.5% | 1.1% |
Demographics Similar to Immigrants from Oceania and Immigrants from Grenada by Vision Disability
In terms of vision disability, the demographic groups most similar to Immigrants from Oceania are Immigrants from North America (2.2%, a difference of 0.040%), Slavic (2.2%, a difference of 0.050%), Uruguayan (2.2%, a difference of 0.16%), Immigrants from Western Europe (2.2%, a difference of 0.26%), and Costa Rican (2.2%, a difference of 0.28%). Similarly, the demographic groups most similar to Immigrants from Grenada are Immigrants (2.2%, a difference of 0.050%), Immigrants from Barbados (2.2%, a difference of 0.070%), Ghanaian (2.2%, a difference of 0.11%), British (2.2%, a difference of 0.17%), and European (2.2%, a difference of 0.22%).
| Demographics | Rating | Rank | Vision Disability |
| Slavs | 46.0 /100 | #177 | Average 2.2% |
| Immigrants | Oceania | 45.1 /100 | #178 | Average 2.2% |
| Immigrants | North America | 44.5 /100 | #179 | Average 2.2% |
| Uruguayans | 42.7 /100 | #180 | Average 2.2% |
| Immigrants | Western Europe | 41.1 /100 | #181 | Average 2.2% |
| Costa Ricans | 40.7 /100 | #182 | Average 2.2% |
| Immigrants | Burma/Myanmar | 37.9 /100 | #183 | Fair 2.2% |
| Moroccans | 35.4 /100 | #184 | Fair 2.2% |
| Immigrants | Middle Africa | 33.5 /100 | #185 | Fair 2.2% |
| Native Hawaiians | 33.3 /100 | #186 | Fair 2.2% |
| Immigrants | St. Vincent and the Grenadines | 30.3 /100 | #187 | Fair 2.2% |
| Guyanese | 28.9 /100 | #188 | Fair 2.2% |
| Salvadorans | 27.4 /100 | #189 | Fair 2.2% |
| Immigrants | Costa Rica | 26.1 /100 | #190 | Fair 2.2% |
| Canadians | 25.8 /100 | #191 | Fair 2.2% |
| Europeans | 25.7 /100 | #192 | Fair 2.2% |
| British | 25.1 /100 | #193 | Fair 2.2% |
| Immigrants | Barbados | 24.0 /100 | #194 | Fair 2.2% |
| Immigrants | Immigrants | 23.7 /100 | #195 | Fair 2.2% |
| Immigrants | Grenada | 23.1 /100 | #196 | Fair 2.2% |
| Ghanaians | 21.8 /100 | #197 | Fair 2.2% |