British vs Syrian Vision Disability
COMPARE
British
Syrian
Vision Disability
Vision Disability Comparison
British
Syrians
2.2%
VISION DISABILITY
25.1/ 100
METRIC RATING
193rd/ 347
METRIC RANK
2.1%
VISION DISABILITY
87.5/ 100
METRIC RATING
133rd/ 347
METRIC RANK
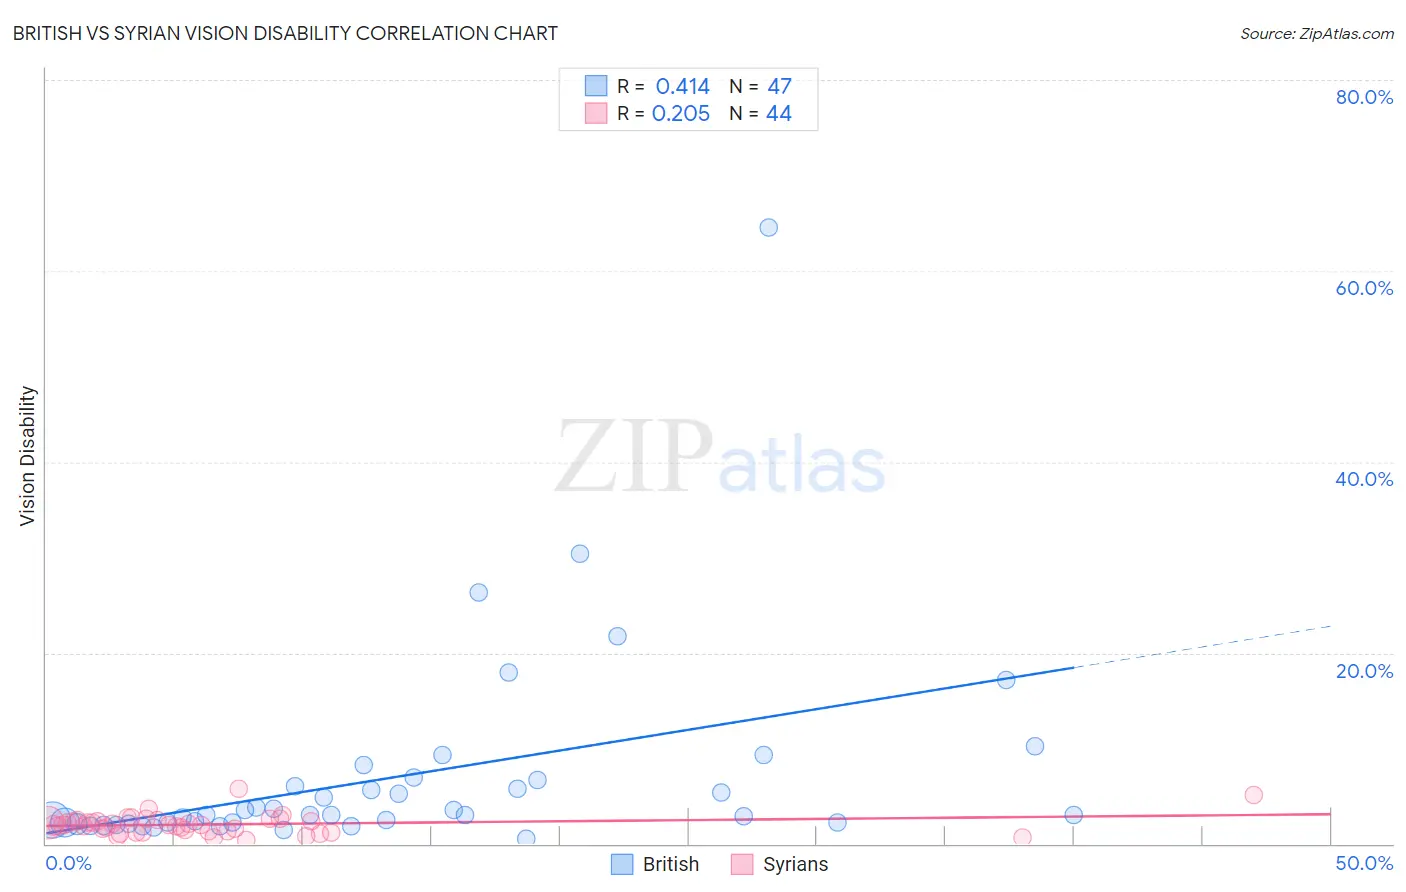
British vs Syrian Vision Disability Correlation Chart
The statistical analysis conducted on geographies consisting of 530,471,861 people shows a moderate positive correlation between the proportion of British and percentage of population with vision disability in the United States with a correlation coefficient (R) of 0.414 and weighted average of 2.2%. Similarly, the statistical analysis conducted on geographies consisting of 266,224,532 people shows a weak positive correlation between the proportion of Syrians and percentage of population with vision disability in the United States with a correlation coefficient (R) of 0.205 and weighted average of 2.1%, a difference of 4.9%.
Vision Disability Correlation Summary
| Measurement | British | Syrian |
| Minimum | 0.53% | 0.46% |
| Maximum | 64.6% | 5.8% |
| Range | 64.1% | 5.3% |
| Mean | 7.1% | 2.0% |
| Median | 3.0% | 2.0% |
| Interquartile 25% (IQ1) | 2.2% | 1.3% |
| Interquartile 75% (IQ3) | 6.6% | 2.4% |
| Interquartile Range (IQR) | 4.5% | 1.1% |
| Standard Deviation (Sample) | 10.8% | 1.0% |
| Standard Deviation (Population) | 10.7% | 1.0% |
Similar Demographics by Vision Disability
Demographics Similar to British by Vision Disability
In terms of vision disability, the demographic groups most similar to British are European (2.2%, a difference of 0.050%), Canadian (2.2%, a difference of 0.060%), Immigrants from Costa Rica (2.2%, a difference of 0.080%), Immigrants from Barbados (2.2%, a difference of 0.090%), and Immigrants (2.2%, a difference of 0.11%).
| Demographics | Rating | Rank | Vision Disability |
| Native Hawaiians | 33.3 /100 | #186 | Fair 2.2% |
| Immigrants | St. Vincent and the Grenadines | 30.3 /100 | #187 | Fair 2.2% |
| Guyanese | 28.9 /100 | #188 | Fair 2.2% |
| Salvadorans | 27.4 /100 | #189 | Fair 2.2% |
| Immigrants | Costa Rica | 26.1 /100 | #190 | Fair 2.2% |
| Canadians | 25.8 /100 | #191 | Fair 2.2% |
| Europeans | 25.7 /100 | #192 | Fair 2.2% |
| British | 25.1 /100 | #193 | Fair 2.2% |
| Immigrants | Barbados | 24.0 /100 | #194 | Fair 2.2% |
| Immigrants | Immigrants | 23.7 /100 | #195 | Fair 2.2% |
| Immigrants | Grenada | 23.1 /100 | #196 | Fair 2.2% |
| Ghanaians | 21.8 /100 | #197 | Fair 2.2% |
| Czechoslovakians | 21.6 /100 | #198 | Fair 2.2% |
| Immigrants | El Salvador | 21.0 /100 | #199 | Fair 2.2% |
| Immigrants | Thailand | 20.1 /100 | #200 | Fair 2.2% |
Demographics Similar to Syrians by Vision Disability
In terms of vision disability, the demographic groups most similar to Syrians are Venezuelan (2.1%, a difference of 0.050%), New Zealander (2.1%, a difference of 0.10%), Vietnamese (2.1%, a difference of 0.12%), Immigrants from Hungary (2.1%, a difference of 0.17%), and Czech (2.1%, a difference of 0.17%).
| Demographics | Rating | Rank | Vision Disability |
| Immigrants | Peru | 89.5 /100 | #126 | Excellent 2.1% |
| Sudanese | 89.2 /100 | #127 | Excellent 2.1% |
| Immigrants | Chile | 89.0 /100 | #128 | Excellent 2.1% |
| Immigrants | Cameroon | 88.8 /100 | #129 | Excellent 2.1% |
| Immigrants | Kenya | 88.7 /100 | #130 | Excellent 2.1% |
| Immigrants | Hungary | 88.7 /100 | #131 | Excellent 2.1% |
| New Zealanders | 88.2 /100 | #132 | Excellent 2.1% |
| Syrians | 87.5 /100 | #133 | Excellent 2.1% |
| Venezuelans | 87.2 /100 | #134 | Excellent 2.1% |
| Vietnamese | 86.7 /100 | #135 | Excellent 2.1% |
| Czechs | 86.3 /100 | #136 | Excellent 2.1% |
| Immigrants | South Eastern Asia | 86.3 /100 | #137 | Excellent 2.1% |
| Arabs | 86.3 /100 | #138 | Excellent 2.1% |
| Immigrants | Morocco | 85.2 /100 | #139 | Excellent 2.1% |
| Immigrants | Netherlands | 84.2 /100 | #140 | Excellent 2.1% |