Immigrants from Oceania vs Syrian Child Poverty Among Boys Under 16
COMPARE
Immigrants from Oceania
Syrian
Child Poverty Among Boys Under 16
Child Poverty Among Boys Under 16 Comparison
Immigrants from Oceania
Syrians
16.0%
CHILD POVERTY AMONG BOYS UNDER 16
71.3/ 100
METRIC RATING
161st/ 347
METRIC RANK
15.9%
CHILD POVERTY AMONG BOYS UNDER 16
77.5/ 100
METRIC RATING
154th/ 347
METRIC RANK
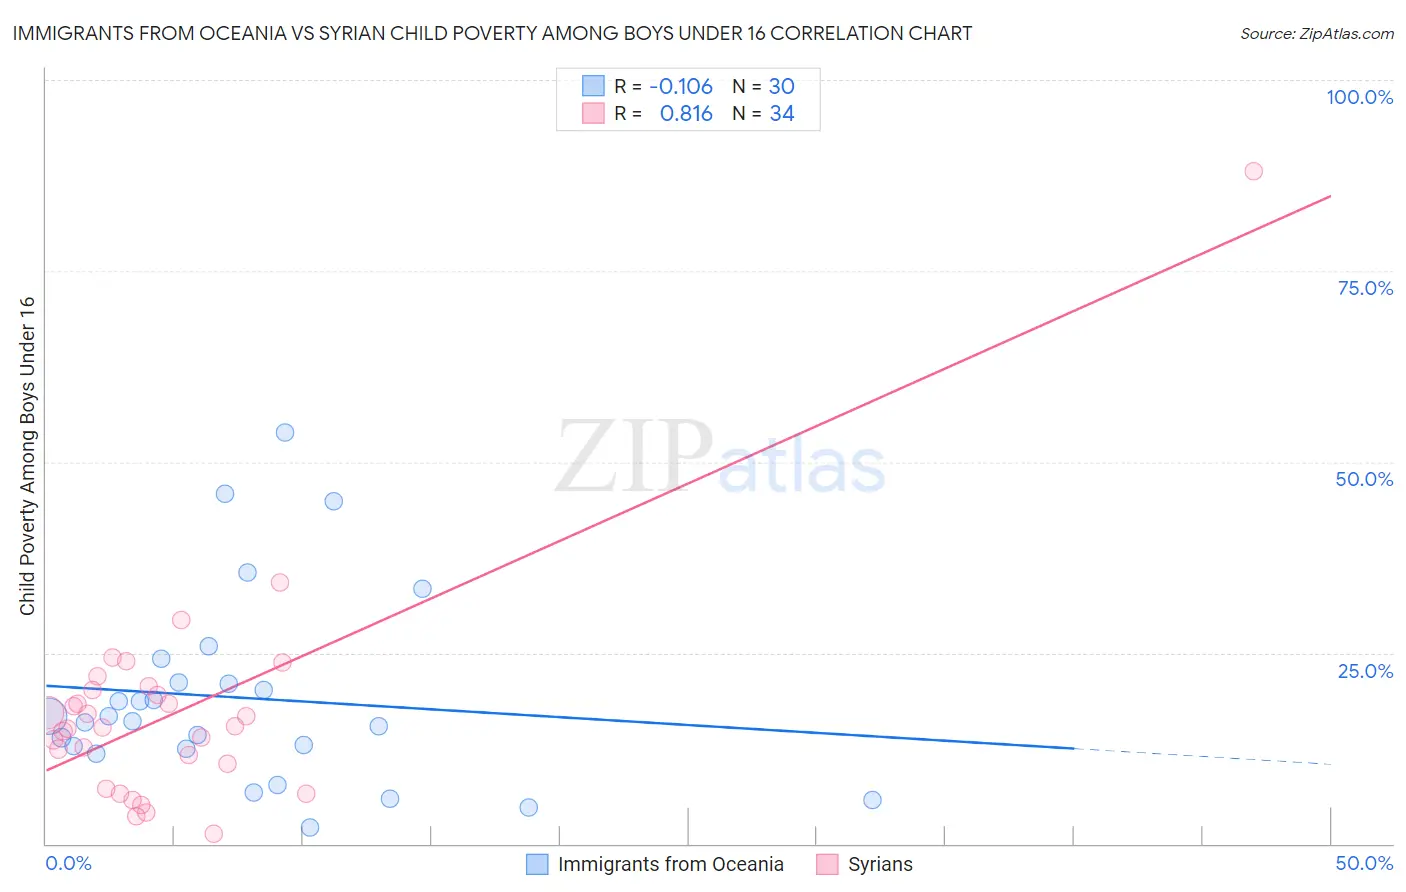
Immigrants from Oceania vs Syrian Child Poverty Among Boys Under 16 Correlation Chart
The statistical analysis conducted on geographies consisting of 301,361,436 people shows a poor negative correlation between the proportion of Immigrants from Oceania and poverty level among boys under the age of 16 in the United States with a correlation coefficient (R) of -0.106 and weighted average of 16.0%. Similarly, the statistical analysis conducted on geographies consisting of 262,504,378 people shows a very strong positive correlation between the proportion of Syrians and poverty level among boys under the age of 16 in the United States with a correlation coefficient (R) of 0.816 and weighted average of 15.9%, a difference of 0.95%.
Child Poverty Among Boys Under 16 Correlation Summary
| Measurement | Immigrants from Oceania | Syrian |
| Minimum | 2.1% | 1.4% |
| Maximum | 53.8% | 88.0% |
| Range | 51.7% | 86.6% |
| Mean | 19.1% | 17.2% |
| Median | 16.3% | 15.3% |
| Interquartile 25% (IQ1) | 12.4% | 10.5% |
| Interquartile 75% (IQ3) | 21.2% | 20.2% |
| Interquartile Range (IQR) | 8.8% | 9.7% |
| Standard Deviation (Sample) | 12.5% | 14.6% |
| Standard Deviation (Population) | 12.3% | 14.4% |
Demographics Similar to Immigrants from Oceania and Syrians by Child Poverty Among Boys Under 16
In terms of child poverty among boys under 16, the demographic groups most similar to Immigrants from Oceania are Immigrants from Northern Africa (16.0%, a difference of 0.010%), Guamanian/Chamorro (16.1%, a difference of 0.23%), Costa Rican (16.1%, a difference of 0.43%), Immigrants from Albania (16.1%, a difference of 0.45%), and Immigrants from Chile (15.9%, a difference of 0.52%). Similarly, the demographic groups most similar to Syrians are French Canadian (15.9%, a difference of 0.15%), Israeli (15.9%, a difference of 0.16%), French (15.8%, a difference of 0.20%), Immigrants from Nepal (15.9%, a difference of 0.25%), and Yugoslavian (15.9%, a difference of 0.26%).
| Demographics | Rating | Rank | Child Poverty Among Boys Under 16 |
| Venezuelans | 82.1 /100 | #147 | Excellent 15.7% |
| Brazilians | 81.0 /100 | #148 | Excellent 15.8% |
| Slovaks | 80.3 /100 | #149 | Excellent 15.8% |
| Immigrants | Jordan | 80.2 /100 | #150 | Excellent 15.8% |
| Puget Sound Salish | 79.8 /100 | #151 | Good 15.8% |
| Immigrants | Venezuela | 79.5 /100 | #152 | Good 15.8% |
| French | 78.7 /100 | #153 | Good 15.8% |
| Syrians | 77.5 /100 | #154 | Good 15.9% |
| French Canadians | 76.6 /100 | #155 | Good 15.9% |
| Israelis | 76.5 /100 | #156 | Good 15.9% |
| Immigrants | Nepal | 76.0 /100 | #157 | Good 15.9% |
| Yugoslavians | 75.9 /100 | #158 | Good 15.9% |
| Immigrants | Chile | 74.8 /100 | #159 | Good 15.9% |
| Immigrants | Northern Africa | 71.3 /100 | #160 | Good 16.0% |
| Immigrants | Oceania | 71.3 /100 | #161 | Good 16.0% |
| Guamanians/Chamorros | 69.6 /100 | #162 | Good 16.1% |
| Costa Ricans | 68.1 /100 | #163 | Good 16.1% |
| Immigrants | Albania | 67.9 /100 | #164 | Good 16.1% |
| Colombians | 65.2 /100 | #165 | Good 16.1% |
| Immigrants | Germany | 63.6 /100 | #166 | Good 16.2% |
| Afghans | 55.4 /100 | #167 | Average 16.3% |