Immigrants from Norway vs Immigrants from Colombia Householder Income Ages 25 - 44 years
COMPARE
Immigrants from Norway
Immigrants from Colombia
Householder Income Ages 25 - 44 years
Householder Income Ages 25 - 44 years Comparison
Immigrants from Norway
Immigrants from Colombia
$106,629
HOUSEHOLDER INCOME AGES 25 - 44 YEARS
99.9/ 100
METRIC RATING
53rd/ 347
METRIC RANK
$92,204
HOUSEHOLDER INCOME AGES 25 - 44 YEARS
21.3/ 100
METRIC RATING
196th/ 347
METRIC RANK
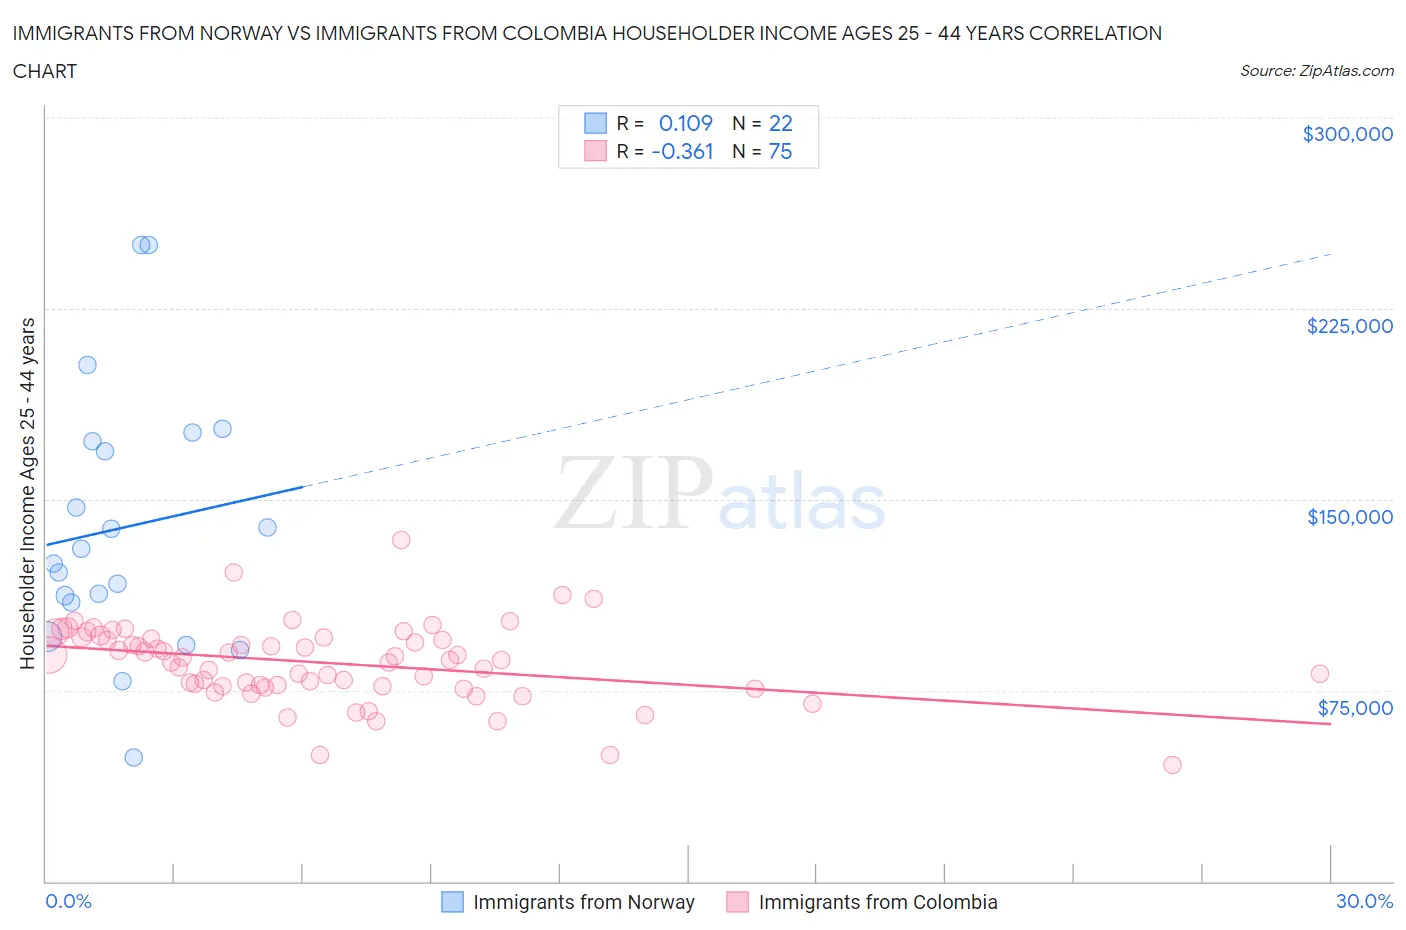
Immigrants from Norway vs Immigrants from Colombia Householder Income Ages 25 - 44 years Correlation Chart
The statistical analysis conducted on geographies consisting of 116,548,648 people shows a poor positive correlation between the proportion of Immigrants from Norway and household income with householder between the ages 25 and 44 in the United States with a correlation coefficient (R) of 0.109 and weighted average of $106,629. Similarly, the statistical analysis conducted on geographies consisting of 377,972,893 people shows a mild negative correlation between the proportion of Immigrants from Colombia and household income with householder between the ages 25 and 44 in the United States with a correlation coefficient (R) of -0.361 and weighted average of $92,204, a difference of 15.6%.
Householder Income Ages 25 - 44 years Correlation Summary
| Measurement | Immigrants from Norway | Immigrants from Colombia |
| Minimum | $48,750 | $45,673 |
| Maximum | $250,001 | $134,128 |
| Range | $201,251 | $88,455 |
| Mean | $138,956 | $85,778 |
| Median | $127,644 | $86,881 |
| Interquartile 25% (IQ1) | $109,255 | $76,505 |
| Interquartile 75% (IQ3) | $172,615 | $95,862 |
| Interquartile Range (IQR) | $63,360 | $19,357 |
| Standard Deviation (Sample) | $51,236 | $15,210 |
| Standard Deviation (Population) | $50,058 | $15,108 |
Similar Demographics by Householder Income Ages 25 - 44 years
Demographics Similar to Immigrants from Norway by Householder Income Ages 25 - 44 years
In terms of householder income ages 25 - 44 years, the demographic groups most similar to Immigrants from Norway are Paraguayan ($106,615, a difference of 0.010%), Greek ($106,457, a difference of 0.16%), Immigrants from Europe ($106,817, a difference of 0.18%), Immigrants from Czechoslovakia ($106,888, a difference of 0.24%), and Immigrants from Pakistan ($106,129, a difference of 0.47%).
| Demographics | Rating | Rank | Householder Income Ages 25 - 44 years |
| Immigrants | Belarus | 99.9 /100 | #46 | Exceptional $107,393 |
| Estonians | 99.9 /100 | #47 | Exceptional $107,269 |
| Bulgarians | 99.9 /100 | #48 | Exceptional $107,264 |
| Immigrants | Turkey | 99.9 /100 | #49 | Exceptional $107,258 |
| Cambodians | 99.9 /100 | #50 | Exceptional $107,148 |
| Immigrants | Czechoslovakia | 99.9 /100 | #51 | Exceptional $106,888 |
| Immigrants | Europe | 99.9 /100 | #52 | Exceptional $106,817 |
| Immigrants | Norway | 99.9 /100 | #53 | Exceptional $106,629 |
| Paraguayans | 99.9 /100 | #54 | Exceptional $106,615 |
| Greeks | 99.9 /100 | #55 | Exceptional $106,457 |
| Immigrants | Pakistan | 99.8 /100 | #56 | Exceptional $106,129 |
| Immigrants | Austria | 99.8 /100 | #57 | Exceptional $106,103 |
| Immigrants | South Africa | 99.8 /100 | #58 | Exceptional $105,748 |
| Immigrants | Latvia | 99.8 /100 | #59 | Exceptional $105,522 |
| Egyptians | 99.7 /100 | #60 | Exceptional $105,282 |
Demographics Similar to Immigrants from Colombia by Householder Income Ages 25 - 44 years
In terms of householder income ages 25 - 44 years, the demographic groups most similar to Immigrants from Colombia are Spanish ($92,200, a difference of 0.0%), Celtic ($92,241, a difference of 0.040%), Vietnamese ($92,089, a difference of 0.12%), Immigrants from the Azores ($92,322, a difference of 0.13%), and Samoan ($92,385, a difference of 0.20%).
| Demographics | Rating | Rank | Householder Income Ages 25 - 44 years |
| Dutch | 30.5 /100 | #189 | Fair $93,081 |
| Welsh | 30.0 /100 | #190 | Fair $93,039 |
| Tlingit-Haida | 29.4 /100 | #191 | Fair $92,987 |
| Immigrants | Costa Rica | 28.2 /100 | #192 | Fair $92,876 |
| Samoans | 23.0 /100 | #193 | Fair $92,385 |
| Immigrants | Azores | 22.4 /100 | #194 | Fair $92,322 |
| Celtics | 21.6 /100 | #195 | Fair $92,241 |
| Immigrants | Colombia | 21.3 /100 | #196 | Fair $92,204 |
| Spanish | 21.2 /100 | #197 | Fair $92,200 |
| Vietnamese | 20.2 /100 | #198 | Fair $92,089 |
| Kenyans | 16.8 /100 | #199 | Poor $91,684 |
| Whites/Caucasians | 16.7 /100 | #200 | Poor $91,668 |
| Japanese | 16.4 /100 | #201 | Poor $91,624 |
| Ecuadorians | 16.0 /100 | #202 | Poor $91,574 |
| Immigrants | Cambodia | 15.7 /100 | #203 | Poor $91,533 |