Immigrants from Norway vs Immigrants from Europe Disability Age 5 to 17
COMPARE
Immigrants from Norway
Immigrants from Europe
Disability Age 5 to 17
Disability Age 5 to 17 Comparison
Immigrants from Norway
Immigrants from Europe
5.6%
DISABILITY AGE 5 TO 17
55.7/ 100
METRIC RATING
169th/ 347
METRIC RANK
5.3%
DISABILITY AGE 5 TO 17
99.0/ 100
METRIC RATING
97th/ 347
METRIC RANK
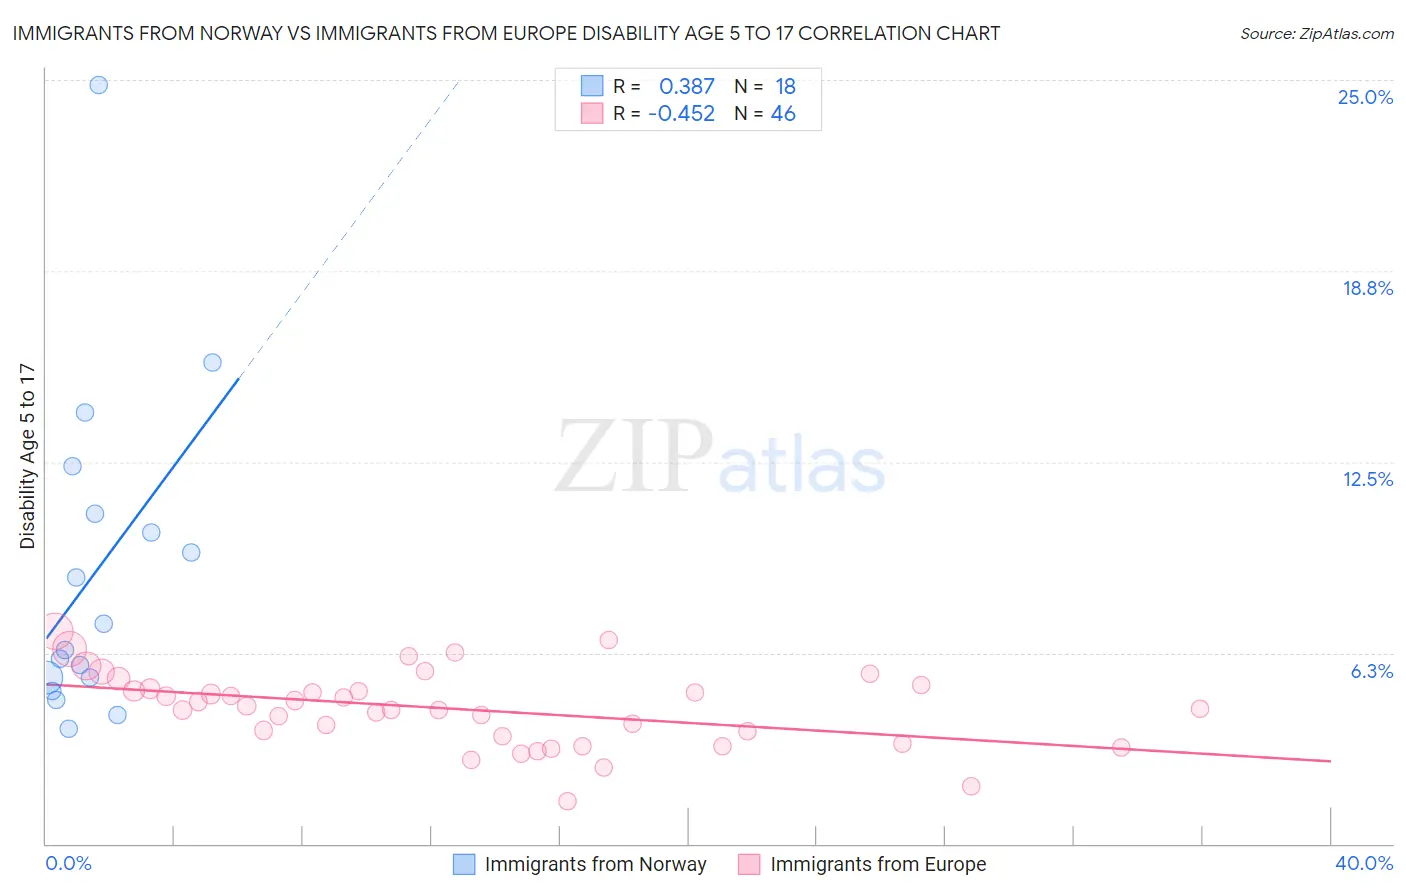
Immigrants from Norway vs Immigrants from Europe Disability Age 5 to 17 Correlation Chart
The statistical analysis conducted on geographies consisting of 116,209,294 people shows a mild positive correlation between the proportion of Immigrants from Norway and percentage of population with a disability between the ages 5 and 17 in the United States with a correlation coefficient (R) of 0.387 and weighted average of 5.6%. Similarly, the statistical analysis conducted on geographies consisting of 537,005,958 people shows a moderate negative correlation between the proportion of Immigrants from Europe and percentage of population with a disability between the ages 5 and 17 in the United States with a correlation coefficient (R) of -0.452 and weighted average of 5.3%, a difference of 5.7%.
Disability Age 5 to 17 Correlation Summary
| Measurement | Immigrants from Norway | Immigrants from Europe |
| Minimum | 3.8% | 1.4% |
| Maximum | 24.8% | 6.9% |
| Range | 21.1% | 5.5% |
| Mean | 8.9% | 4.4% |
| Median | 6.8% | 4.5% |
| Interquartile 25% (IQ1) | 5.4% | 3.5% |
| Interquartile 75% (IQ3) | 10.8% | 5.1% |
| Interquartile Range (IQR) | 5.4% | 1.6% |
| Standard Deviation (Sample) | 5.3% | 1.2% |
| Standard Deviation (Population) | 5.1% | 1.2% |
Similar Demographics by Disability Age 5 to 17
Demographics Similar to Immigrants from Norway by Disability Age 5 to 17
In terms of disability age 5 to 17, the demographic groups most similar to Immigrants from Norway are Iraqi (5.6%, a difference of 0.020%), Serbian (5.6%, a difference of 0.080%), Immigrants from Iraq (5.6%, a difference of 0.090%), Immigrants from Burma/Myanmar (5.6%, a difference of 0.18%), and Ukrainian (5.6%, a difference of 0.21%).
| Demographics | Rating | Rank | Disability Age 5 to 17 |
| Zimbabweans | 67.2 /100 | #162 | Good 5.5% |
| Immigrants | Southern Europe | 64.0 /100 | #163 | Good 5.6% |
| Immigrants | Scotland | 61.9 /100 | #164 | Good 5.6% |
| Lebanese | 61.4 /100 | #165 | Good 5.6% |
| Greeks | 60.6 /100 | #166 | Good 5.6% |
| Immigrants | Burma/Myanmar | 59.3 /100 | #167 | Average 5.6% |
| Iraqis | 56.0 /100 | #168 | Average 5.6% |
| Immigrants | Norway | 55.7 /100 | #169 | Average 5.6% |
| Serbians | 54.0 /100 | #170 | Average 5.6% |
| Immigrants | Iraq | 53.9 /100 | #171 | Average 5.6% |
| Ukrainians | 51.5 /100 | #172 | Average 5.6% |
| Uruguayans | 51.0 /100 | #173 | Average 5.6% |
| Costa Ricans | 50.0 /100 | #174 | Average 5.6% |
| Shoshone | 49.4 /100 | #175 | Average 5.6% |
| Immigrants | Central America | 49.4 /100 | #176 | Average 5.6% |
Demographics Similar to Immigrants from Europe by Disability Age 5 to 17
In terms of disability age 5 to 17, the demographic groups most similar to Immigrants from Europe are Immigrants from El Salvador (5.3%, a difference of 0.0%), Immigrants from Austria (5.3%, a difference of 0.050%), Cambodian (5.3%, a difference of 0.15%), Immigrants from Grenada (5.3%, a difference of 0.16%), and Immigrants from Jordan (5.3%, a difference of 0.18%).
| Demographics | Rating | Rank | Disability Age 5 to 17 |
| Immigrants | Kuwait | 99.4 /100 | #90 | Exceptional 5.3% |
| Mongolians | 99.2 /100 | #91 | Exceptional 5.3% |
| Luxembourgers | 99.2 /100 | #92 | Exceptional 5.3% |
| Immigrants | Peru | 99.1 /100 | #93 | Exceptional 5.3% |
| Immigrants | Jordan | 99.1 /100 | #94 | Exceptional 5.3% |
| Immigrants | Grenada | 99.1 /100 | #95 | Exceptional 5.3% |
| Immigrants | El Salvador | 99.0 /100 | #96 | Exceptional 5.3% |
| Immigrants | Europe | 99.0 /100 | #97 | Exceptional 5.3% |
| Immigrants | Austria | 98.9 /100 | #98 | Exceptional 5.3% |
| Cambodians | 98.8 /100 | #99 | Exceptional 5.3% |
| Nepalese | 98.7 /100 | #100 | Exceptional 5.3% |
| Menominee | 98.7 /100 | #101 | Exceptional 5.3% |
| Nicaraguans | 98.6 /100 | #102 | Exceptional 5.3% |
| Salvadorans | 98.6 /100 | #103 | Exceptional 5.3% |
| Peruvians | 98.5 /100 | #104 | Exceptional 5.3% |