Tohono O'odham vs Immigrants from Central America Disability
COMPARE
Tohono O'odham
Immigrants from Central America
Disability
Disability Comparison
Tohono O'odham
Immigrants from Central America
14.8%
DISABILITY
0.0/ 100
METRIC RATING
335th/ 347
METRIC RANK
11.7%
DISABILITY
46.6/ 100
METRIC RATING
177th/ 347
METRIC RANK
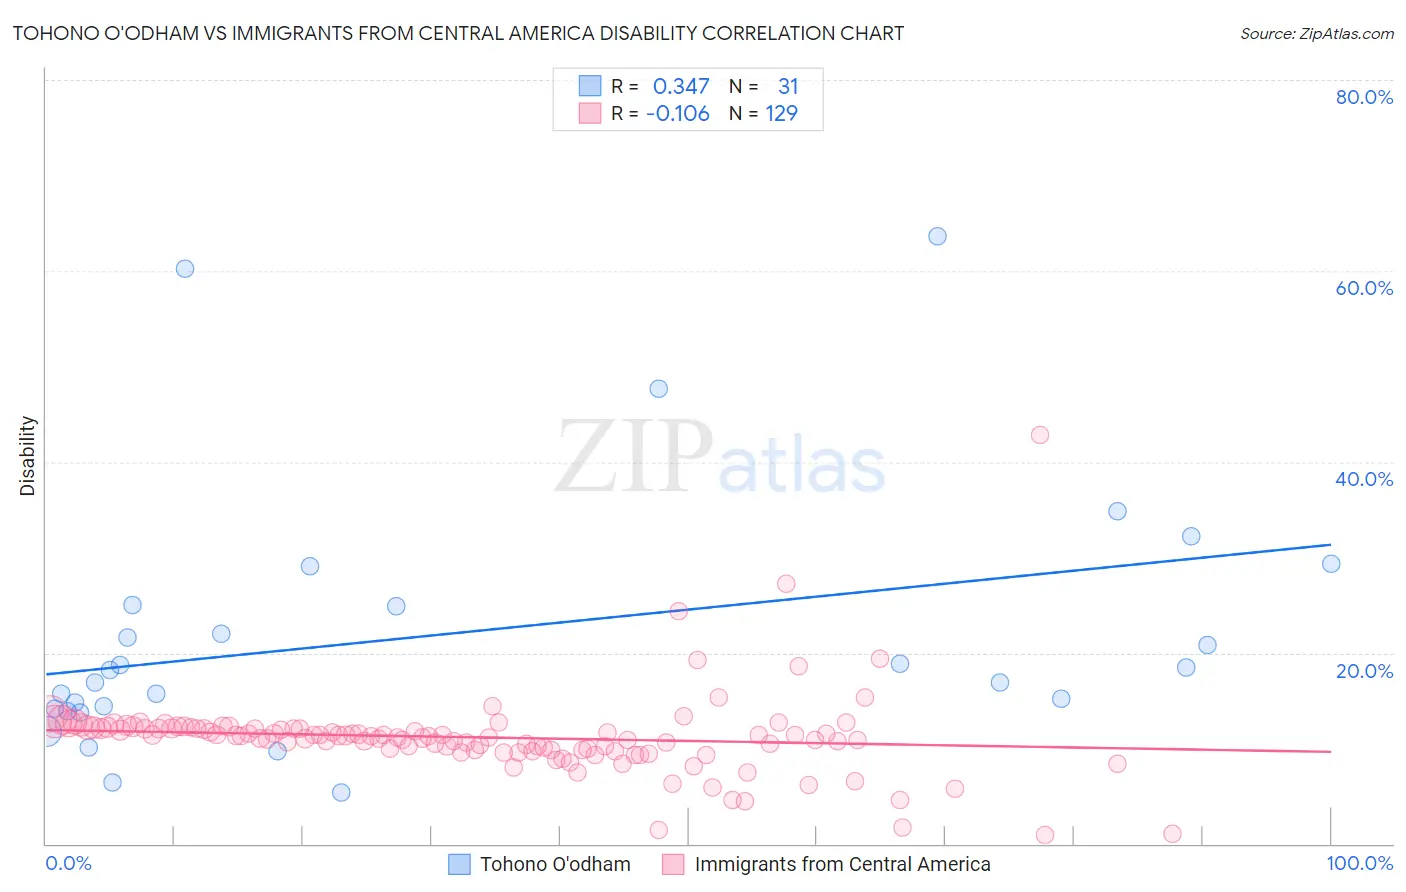
Tohono O'odham vs Immigrants from Central America Disability Correlation Chart
The statistical analysis conducted on geographies consisting of 58,721,793 people shows a mild positive correlation between the proportion of Tohono O'odham and percentage of population with a disability in the United States with a correlation coefficient (R) of 0.347 and weighted average of 14.8%. Similarly, the statistical analysis conducted on geographies consisting of 536,390,907 people shows a poor negative correlation between the proportion of Immigrants from Central America and percentage of population with a disability in the United States with a correlation coefficient (R) of -0.106 and weighted average of 11.7%, a difference of 26.1%.
Disability Correlation Summary
| Measurement | Tohono O'odham | Immigrants from Central America |
| Minimum | 5.4% | 0.89% |
| Maximum | 63.6% | 42.9% |
| Range | 58.3% | 42.0% |
| Mean | 21.9% | 11.1% |
| Median | 18.2% | 11.3% |
| Interquartile 25% (IQ1) | 14.1% | 9.8% |
| Interquartile 75% (IQ3) | 25.0% | 12.1% |
| Interquartile Range (IQR) | 10.9% | 2.3% |
| Standard Deviation (Sample) | 13.8% | 4.4% |
| Standard Deviation (Population) | 13.5% | 4.4% |
Similar Demographics by Disability
Demographics Similar to Tohono O'odham by Disability
In terms of disability, the demographic groups most similar to Tohono O'odham are Cherokee (14.8%, a difference of 0.51%), Seminole (14.9%, a difference of 0.61%), Dutch West Indian (14.9%, a difference of 0.91%), Yuman (14.6%, a difference of 1.0%), and Cajun (14.6%, a difference of 1.2%).
| Demographics | Rating | Rank | Disability |
| Immigrants | Azores | 0.0 /100 | #328 | Tragic 14.2% |
| Potawatomi | 0.0 /100 | #329 | Tragic 14.2% |
| Navajo | 0.0 /100 | #330 | Tragic 14.3% |
| Alaskan Athabascans | 0.0 /100 | #331 | Tragic 14.4% |
| Pueblo | 0.0 /100 | #332 | Tragic 14.4% |
| Cajuns | 0.0 /100 | #333 | Tragic 14.6% |
| Yuman | 0.0 /100 | #334 | Tragic 14.6% |
| Tohono O'odham | 0.0 /100 | #335 | Tragic 14.8% |
| Cherokee | 0.0 /100 | #336 | Tragic 14.8% |
| Seminole | 0.0 /100 | #337 | Tragic 14.9% |
| Dutch West Indians | 0.0 /100 | #338 | Tragic 14.9% |
| Chickasaw | 0.0 /100 | #339 | Tragic 15.2% |
| Choctaw | 0.0 /100 | #340 | Tragic 15.4% |
| Lumbee | 0.0 /100 | #341 | Tragic 15.5% |
| Kiowa | 0.0 /100 | #342 | Tragic 15.6% |
Demographics Similar to Immigrants from Central America by Disability
In terms of disability, the demographic groups most similar to Immigrants from Central America are Greek (11.7%, a difference of 0.020%), Immigrants from Western Africa (11.7%, a difference of 0.040%), Haitian (11.7%, a difference of 0.090%), Albanian (11.7%, a difference of 0.15%), and Maltese (11.7%, a difference of 0.18%).
| Demographics | Rating | Rank | Disability |
| Immigrants | Albania | 52.8 /100 | #170 | Average 11.7% |
| Immigrants | Southern Europe | 52.8 /100 | #171 | Average 11.7% |
| Trinidadians and Tobagonians | 52.7 /100 | #172 | Average 11.7% |
| Maltese | 50.6 /100 | #173 | Average 11.7% |
| Albanians | 50.0 /100 | #174 | Average 11.7% |
| Haitians | 48.6 /100 | #175 | Average 11.7% |
| Immigrants | Western Africa | 47.5 /100 | #176 | Average 11.7% |
| Immigrants | Central America | 46.6 /100 | #177 | Average 11.7% |
| Greeks | 46.2 /100 | #178 | Average 11.7% |
| Immigrants | Armenia | 41.9 /100 | #179 | Average 11.7% |
| Immigrants | Honduras | 37.8 /100 | #180 | Fair 11.8% |
| Immigrants | Oceania | 34.3 /100 | #181 | Fair 11.8% |
| Icelanders | 34.0 /100 | #182 | Fair 11.8% |
| Hondurans | 31.2 /100 | #183 | Fair 11.8% |
| Iraqis | 30.0 /100 | #184 | Fair 11.8% |