Immigrants from Norway vs Immigrants from Central America Median Female Earnings
COMPARE
Immigrants from Norway
Immigrants from Central America
Median Female Earnings
Median Female Earnings Comparison
Immigrants from Norway
Immigrants from Central America
$42,837
MEDIAN FEMALE EARNINGS
99.9/ 100
METRIC RATING
66th/ 347
METRIC RANK
$33,953
MEDIAN FEMALE EARNINGS
0.0/ 100
METRIC RATING
328th/ 347
METRIC RANK
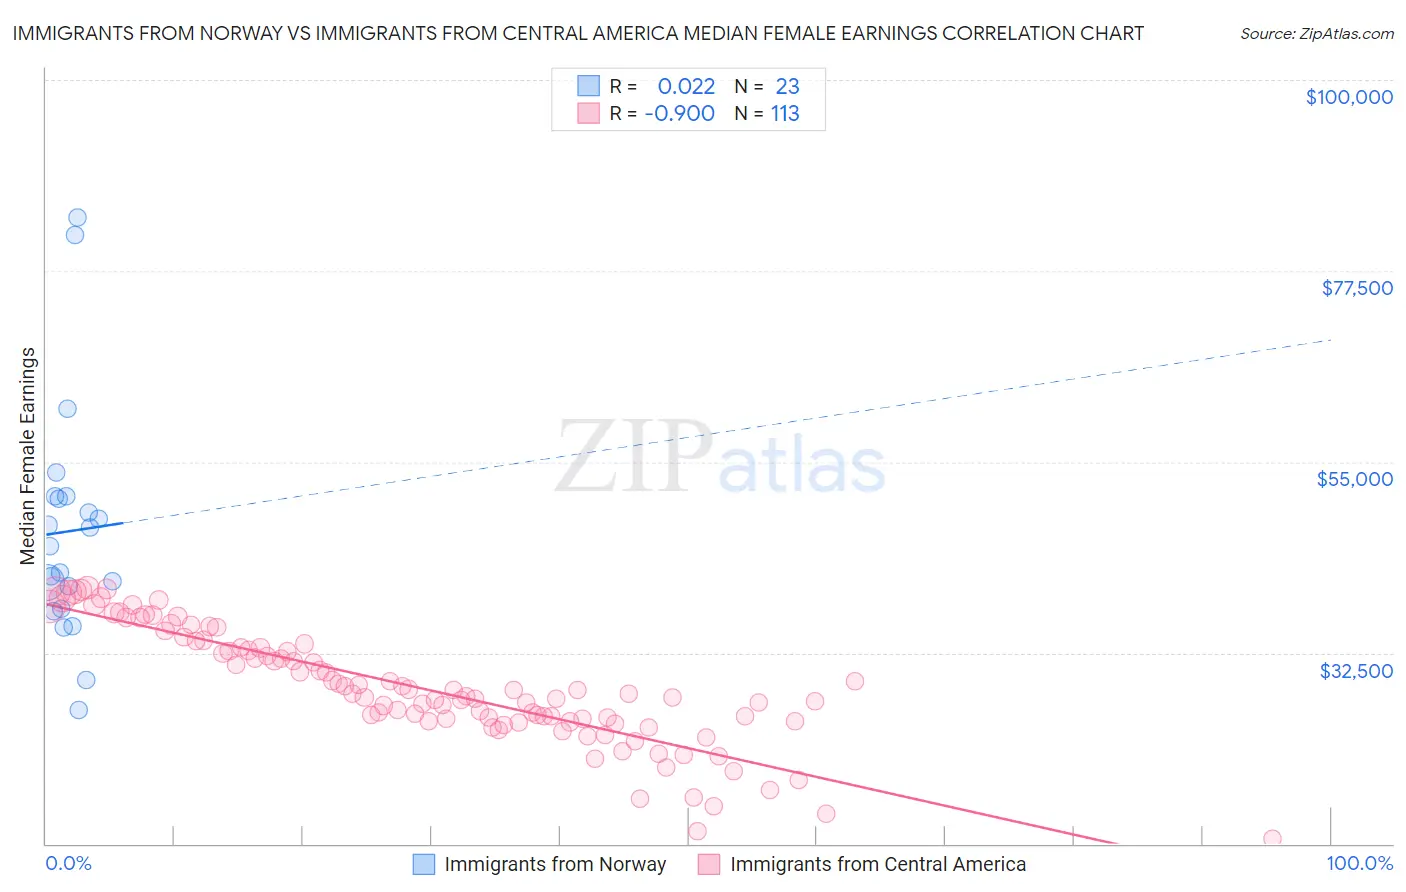
Immigrants from Norway vs Immigrants from Central America Median Female Earnings Correlation Chart
The statistical analysis conducted on geographies consisting of 116,697,364 people shows no correlation between the proportion of Immigrants from Norway and median female earnings in the United States with a correlation coefficient (R) of 0.022 and weighted average of $42,837. Similarly, the statistical analysis conducted on geographies consisting of 535,445,485 people shows a near-perfect negative correlation between the proportion of Immigrants from Central America and median female earnings in the United States with a correlation coefficient (R) of -0.900 and weighted average of $33,953, a difference of 26.2%.
Median Female Earnings Correlation Summary
| Measurement | Immigrants from Norway | Immigrants from Central America |
| Minimum | $25,783 | $10,532 |
| Maximum | $83,727 | $40,138 |
| Range | $57,944 | $29,606 |
| Mean | $46,834 | $28,383 |
| Median | $44,998 | $27,631 |
| Interquartile 25% (IQ1) | $37,628 | $24,472 |
| Interquartile 75% (IQ3) | $50,939 | $33,368 |
| Interquartile Range (IQR) | $13,311 | $8,895 |
| Standard Deviation (Sample) | $13,874 | $6,771 |
| Standard Deviation (Population) | $13,569 | $6,741 |
Similar Demographics by Median Female Earnings
Demographics Similar to Immigrants from Norway by Median Female Earnings
In terms of median female earnings, the demographic groups most similar to Immigrants from Norway are Immigrants from Egypt ($42,837, a difference of 0.0%), Immigrants from Austria ($42,824, a difference of 0.030%), Immigrants from Spain ($42,815, a difference of 0.050%), Sierra Leonean ($42,868, a difference of 0.070%), and Immigrants from Ethiopia ($42,744, a difference of 0.22%).
| Demographics | Rating | Rank | Median Female Earnings |
| Estonians | 99.9 /100 | #59 | Exceptional $43,106 |
| Immigrants | Latvia | 99.9 /100 | #60 | Exceptional $43,099 |
| Immigrants | Bulgaria | 99.9 /100 | #61 | Exceptional $43,085 |
| Afghans | 99.9 /100 | #62 | Exceptional $43,077 |
| Immigrants | Ukraine | 99.9 /100 | #63 | Exceptional $43,069 |
| Immigrants | Pakistan | 99.9 /100 | #64 | Exceptional $43,052 |
| Sierra Leoneans | 99.9 /100 | #65 | Exceptional $42,868 |
| Immigrants | Norway | 99.9 /100 | #66 | Exceptional $42,837 |
| Immigrants | Egypt | 99.9 /100 | #67 | Exceptional $42,837 |
| Immigrants | Austria | 99.8 /100 | #68 | Exceptional $42,824 |
| Immigrants | Spain | 99.8 /100 | #69 | Exceptional $42,815 |
| Immigrants | Ethiopia | 99.8 /100 | #70 | Exceptional $42,744 |
| Immigrants | Romania | 99.8 /100 | #71 | Exceptional $42,718 |
| Albanians | 99.8 /100 | #72 | Exceptional $42,584 |
| Mongolians | 99.7 /100 | #73 | Exceptional $42,542 |
Demographics Similar to Immigrants from Central America by Median Female Earnings
In terms of median female earnings, the demographic groups most similar to Immigrants from Central America are Hopi ($33,932, a difference of 0.060%), Menominee ($33,894, a difference of 0.17%), Cajun ($34,034, a difference of 0.24%), Kiowa ($34,074, a difference of 0.36%), and Native/Alaskan ($33,806, a difference of 0.43%).
| Demographics | Rating | Rank | Median Female Earnings |
| Hispanics or Latinos | 0.0 /100 | #321 | Tragic $34,421 |
| Chickasaw | 0.0 /100 | #322 | Tragic $34,414 |
| Seminole | 0.0 /100 | #323 | Tragic $34,385 |
| Immigrants | Congo | 0.0 /100 | #324 | Tragic $34,317 |
| Dutch West Indians | 0.0 /100 | #325 | Tragic $34,106 |
| Kiowa | 0.0 /100 | #326 | Tragic $34,074 |
| Cajuns | 0.0 /100 | #327 | Tragic $34,034 |
| Immigrants | Central America | 0.0 /100 | #328 | Tragic $33,953 |
| Hopi | 0.0 /100 | #329 | Tragic $33,932 |
| Menominee | 0.0 /100 | #330 | Tragic $33,894 |
| Natives/Alaskans | 0.0 /100 | #331 | Tragic $33,806 |
| Choctaw | 0.0 /100 | #332 | Tragic $33,775 |
| Mexicans | 0.0 /100 | #333 | Tragic $33,664 |
| Spanish American Indians | 0.0 /100 | #334 | Tragic $33,625 |
| Creek | 0.0 /100 | #335 | Tragic $33,437 |