Immigrants from North America vs Immigrants from England Hearing Disability
COMPARE
Immigrants from North America
Immigrants from England
Hearing Disability
Hearing Disability Comparison
Immigrants from North America
Immigrants from England
3.5%
HEARING DISABILITY
0.1/ 100
METRIC RATING
262nd/ 347
METRIC RANK
3.3%
HEARING DISABILITY
0.7/ 100
METRIC RATING
246th/ 347
METRIC RANK
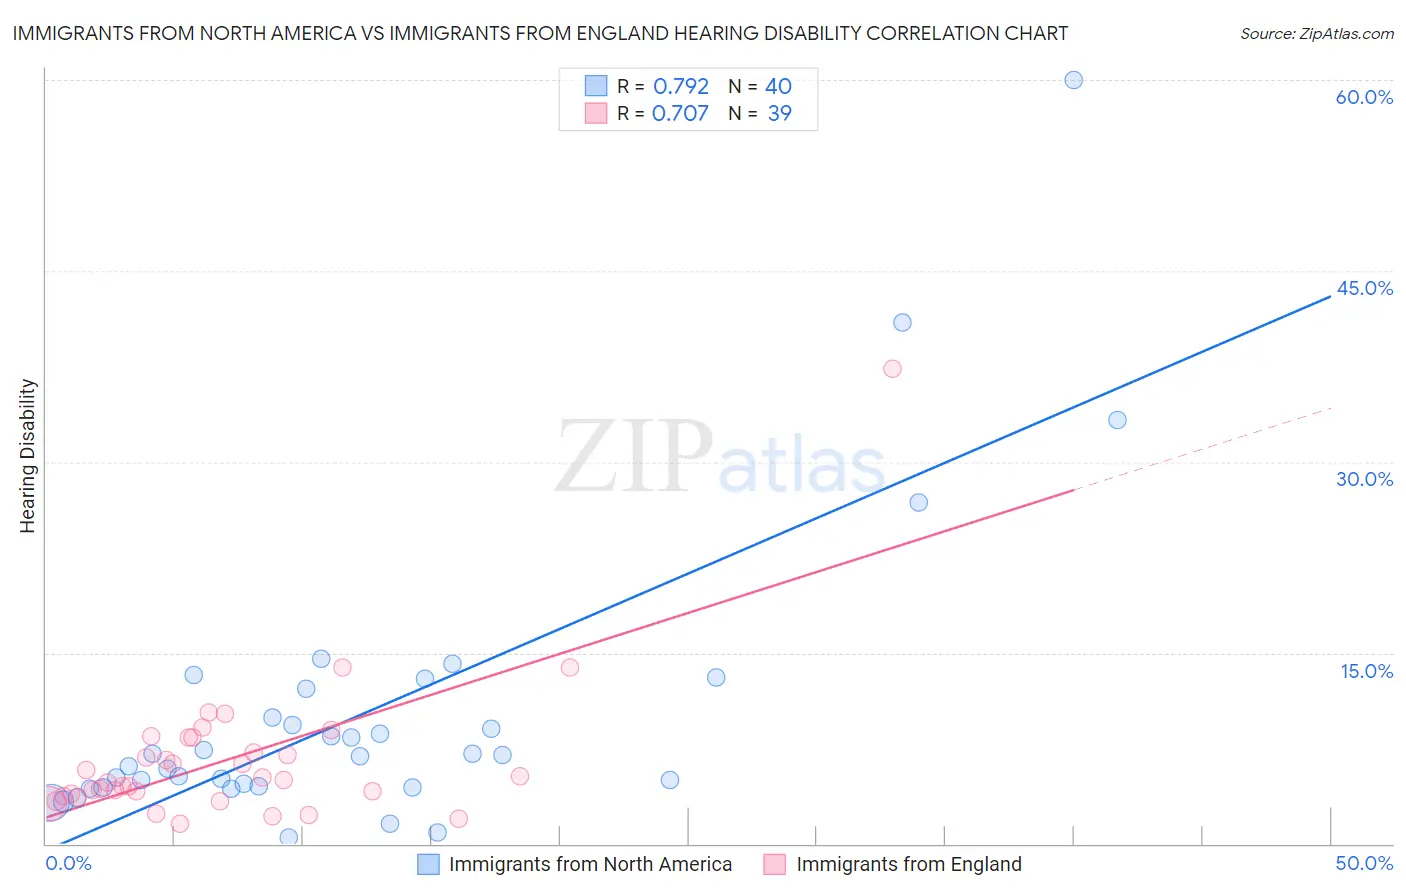
Immigrants from North America vs Immigrants from England Hearing Disability Correlation Chart
The statistical analysis conducted on geographies consisting of 462,279,927 people shows a strong positive correlation between the proportion of Immigrants from North America and percentage of population with hearing disability in the United States with a correlation coefficient (R) of 0.792 and weighted average of 3.5%. Similarly, the statistical analysis conducted on geographies consisting of 391,804,752 people shows a strong positive correlation between the proportion of Immigrants from England and percentage of population with hearing disability in the United States with a correlation coefficient (R) of 0.707 and weighted average of 3.3%, a difference of 3.6%.
Hearing Disability Correlation Summary
| Measurement | Immigrants from North America | Immigrants from England |
| Minimum | 0.49% | 1.6% |
| Maximum | 60.0% | 37.3% |
| Range | 59.5% | 35.7% |
| Mean | 10.2% | 6.6% |
| Median | 7.0% | 5.0% |
| Interquartile 25% (IQ1) | 4.5% | 3.8% |
| Interquartile 75% (IQ3) | 11.0% | 8.3% |
| Interquartile Range (IQR) | 6.6% | 4.5% |
| Standard Deviation (Sample) | 11.5% | 5.9% |
| Standard Deviation (Population) | 11.3% | 5.8% |
Demographics Similar to Immigrants from North America and Immigrants from England by Hearing Disability
In terms of hearing disability, the demographic groups most similar to Immigrants from North America are Immigrants from Canada (3.5%, a difference of 0.040%), Hawaiian (3.5%, a difference of 0.11%), Portuguese (3.5%, a difference of 0.15%), Slovene (3.5%, a difference of 0.23%), and Immigrants from Germany (3.5%, a difference of 0.26%). Similarly, the demographic groups most similar to Immigrants from England are Lithuanian (3.4%, a difference of 0.20%), Immigrants from Scotland (3.3%, a difference of 0.28%), Austrian (3.4%, a difference of 0.42%), Assyrian/Chaldean/Syriac (3.3%, a difference of 0.62%), and Italian (3.4%, a difference of 0.95%).
| Demographics | Rating | Rank | Hearing Disability |
| Assyrians/Chaldeans/Syriacs | 0.9 /100 | #244 | Tragic 3.3% |
| Immigrants | Scotland | 0.8 /100 | #245 | Tragic 3.3% |
| Immigrants | England | 0.7 /100 | #246 | Tragic 3.3% |
| Lithuanians | 0.6 /100 | #247 | Tragic 3.4% |
| Austrians | 0.6 /100 | #248 | Tragic 3.4% |
| Italians | 0.4 /100 | #249 | Tragic 3.4% |
| Yuman | 0.4 /100 | #250 | Tragic 3.4% |
| Hungarians | 0.4 /100 | #251 | Tragic 3.4% |
| Croatians | 0.4 /100 | #252 | Tragic 3.4% |
| Carpatho Rusyns | 0.3 /100 | #253 | Tragic 3.4% |
| Slavs | 0.2 /100 | #254 | Tragic 3.4% |
| Poles | 0.2 /100 | #255 | Tragic 3.4% |
| Hmong | 0.2 /100 | #256 | Tragic 3.4% |
| Yaqui | 0.2 /100 | #257 | Tragic 3.4% |
| Northern Europeans | 0.2 /100 | #258 | Tragic 3.4% |
| Slovenes | 0.1 /100 | #259 | Tragic 3.5% |
| Portuguese | 0.1 /100 | #260 | Tragic 3.5% |
| Hawaiians | 0.1 /100 | #261 | Tragic 3.5% |
| Immigrants | North America | 0.1 /100 | #262 | Tragic 3.5% |
| Immigrants | Canada | 0.1 /100 | #263 | Tragic 3.5% |
| Immigrants | Germany | 0.1 /100 | #264 | Tragic 3.5% |