Immigrants from North America vs Immigrants from Iraq Hearing Disability
COMPARE
Immigrants from North America
Immigrants from Iraq
Hearing Disability
Hearing Disability Comparison
Immigrants from North America
Immigrants from Iraq
3.5%
HEARING DISABILITY
0.1/ 100
METRIC RATING
262nd/ 347
METRIC RANK
3.1%
HEARING DISABILITY
10.5/ 100
METRIC RATING
213th/ 347
METRIC RANK
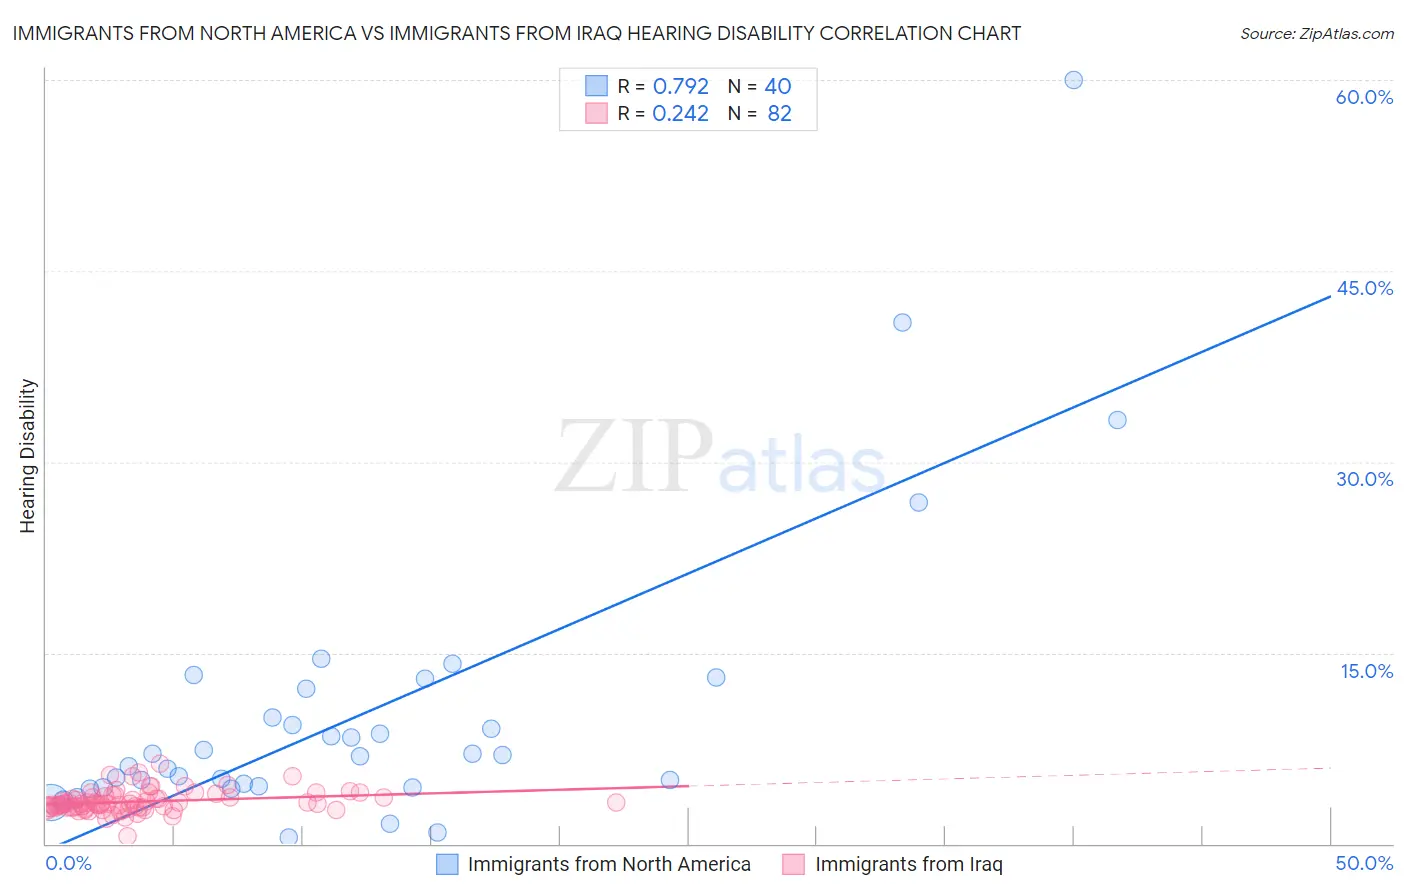
Immigrants from North America vs Immigrants from Iraq Hearing Disability Correlation Chart
The statistical analysis conducted on geographies consisting of 462,279,927 people shows a strong positive correlation between the proportion of Immigrants from North America and percentage of population with hearing disability in the United States with a correlation coefficient (R) of 0.792 and weighted average of 3.5%. Similarly, the statistical analysis conducted on geographies consisting of 194,749,544 people shows a weak positive correlation between the proportion of Immigrants from Iraq and percentage of population with hearing disability in the United States with a correlation coefficient (R) of 0.242 and weighted average of 3.1%, a difference of 10.1%.
Hearing Disability Correlation Summary
| Measurement | Immigrants from North America | Immigrants from Iraq |
| Minimum | 0.49% | 0.59% |
| Maximum | 60.0% | 6.3% |
| Range | 59.5% | 5.7% |
| Mean | 10.2% | 3.3% |
| Median | 7.0% | 3.1% |
| Interquartile 25% (IQ1) | 4.5% | 2.8% |
| Interquartile 75% (IQ3) | 11.0% | 3.6% |
| Interquartile Range (IQR) | 6.6% | 0.81% |
| Standard Deviation (Sample) | 11.5% | 0.86% |
| Standard Deviation (Population) | 11.3% | 0.86% |
Similar Demographics by Hearing Disability
Demographics Similar to Immigrants from North America by Hearing Disability
In terms of hearing disability, the demographic groups most similar to Immigrants from North America are Immigrants from Canada (3.5%, a difference of 0.040%), Hawaiian (3.5%, a difference of 0.11%), Portuguese (3.5%, a difference of 0.15%), Slovene (3.5%, a difference of 0.23%), and Immigrants from Germany (3.5%, a difference of 0.26%).
| Demographics | Rating | Rank | Hearing Disability |
| Poles | 0.2 /100 | #255 | Tragic 3.4% |
| Hmong | 0.2 /100 | #256 | Tragic 3.4% |
| Yaqui | 0.2 /100 | #257 | Tragic 3.4% |
| Northern Europeans | 0.2 /100 | #258 | Tragic 3.4% |
| Slovenes | 0.1 /100 | #259 | Tragic 3.5% |
| Portuguese | 0.1 /100 | #260 | Tragic 3.5% |
| Hawaiians | 0.1 /100 | #261 | Tragic 3.5% |
| Immigrants | North America | 0.1 /100 | #262 | Tragic 3.5% |
| Immigrants | Canada | 0.1 /100 | #263 | Tragic 3.5% |
| Immigrants | Germany | 0.1 /100 | #264 | Tragic 3.5% |
| British | 0.1 /100 | #265 | Tragic 3.5% |
| Belgians | 0.1 /100 | #266 | Tragic 3.5% |
| Canadians | 0.1 /100 | #267 | Tragic 3.5% |
| Spaniards | 0.1 /100 | #268 | Tragic 3.5% |
| Ute | 0.1 /100 | #269 | Tragic 3.5% |
Demographics Similar to Immigrants from Iraq by Hearing Disability
In terms of hearing disability, the demographic groups most similar to Immigrants from Iraq are Pakistani (3.1%, a difference of 0.15%), Romanian (3.1%, a difference of 0.36%), Cape Verdean (3.1%, a difference of 0.39%), Immigrants from Hungary (3.1%, a difference of 0.44%), and Immigrants from Latvia (3.1%, a difference of 0.48%).
| Demographics | Rating | Rank | Hearing Disability |
| Eastern Europeans | 15.5 /100 | #206 | Poor 3.1% |
| Hispanics or Latinos | 15.1 /100 | #207 | Poor 3.1% |
| Immigrants | Latvia | 12.7 /100 | #208 | Poor 3.1% |
| Immigrants | Hungary | 12.5 /100 | #209 | Poor 3.1% |
| Cape Verdeans | 12.2 /100 | #210 | Poor 3.1% |
| Romanians | 12.1 /100 | #211 | Poor 3.1% |
| Pakistanis | 11.1 /100 | #212 | Poor 3.1% |
| Immigrants | Iraq | 10.5 /100 | #213 | Poor 3.1% |
| Australians | 8.1 /100 | #214 | Tragic 3.2% |
| Bangladeshis | 8.1 /100 | #215 | Tragic 3.2% |
| Immigrants | Norway | 7.3 /100 | #216 | Tragic 3.2% |
| Russians | 7.1 /100 | #217 | Tragic 3.2% |
| Immigrants | Northern Europe | 7.0 /100 | #218 | Tragic 3.2% |
| New Zealanders | 6.8 /100 | #219 | Tragic 3.2% |
| Malaysians | 6.6 /100 | #220 | Tragic 3.2% |