Immigrants from North America vs Danish Hearing Disability
COMPARE
Immigrants from North America
Danish
Hearing Disability
Hearing Disability Comparison
Immigrants from North America
Danes
3.5%
HEARING DISABILITY
0.1/ 100
METRIC RATING
262nd/ 347
METRIC RANK
3.6%
HEARING DISABILITY
0.0/ 100
METRIC RATING
276th/ 347
METRIC RANK
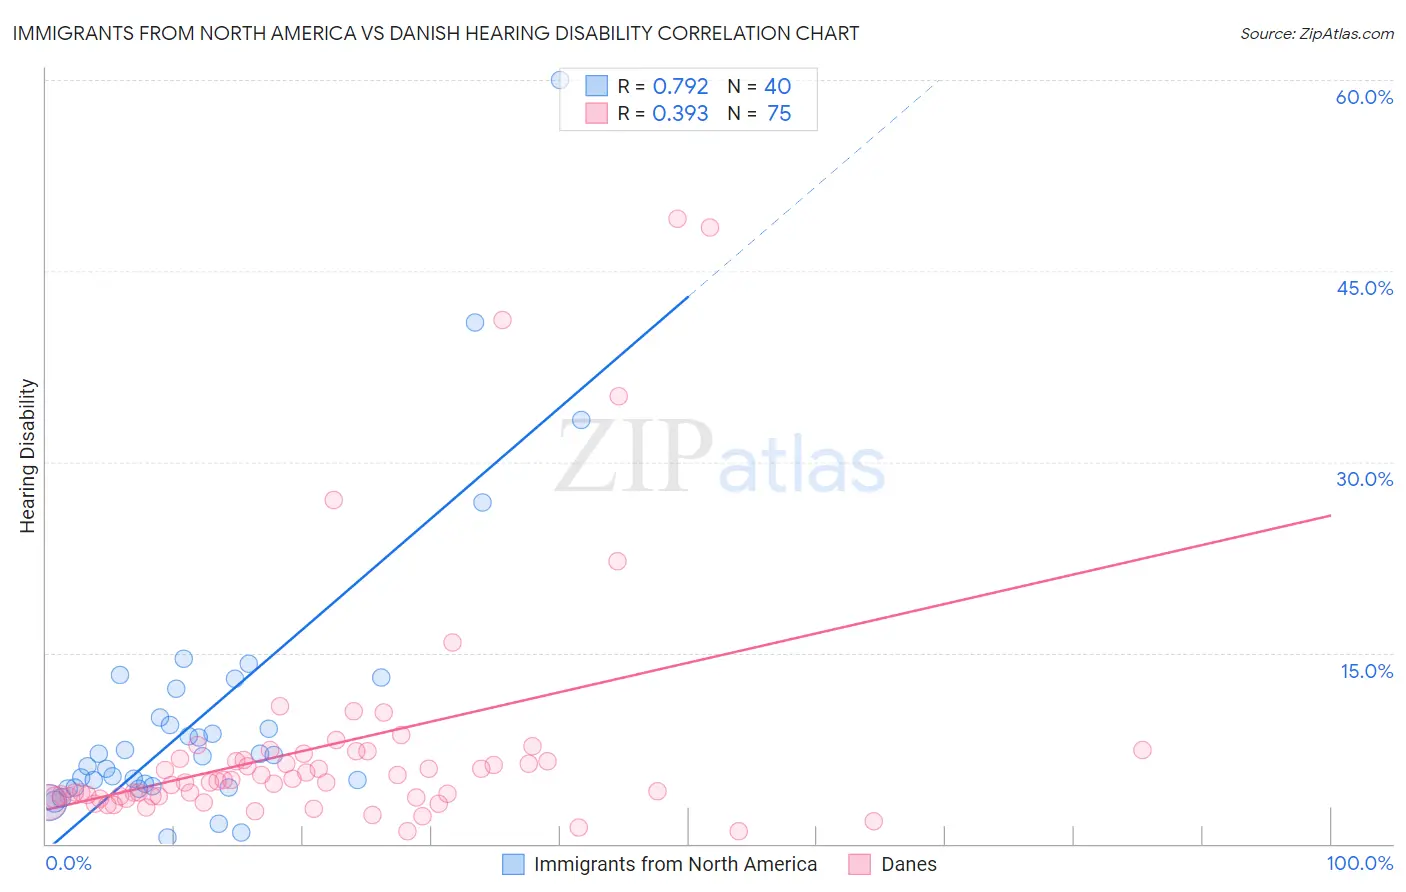
Immigrants from North America vs Danish Hearing Disability Correlation Chart
The statistical analysis conducted on geographies consisting of 462,279,927 people shows a strong positive correlation between the proportion of Immigrants from North America and percentage of population with hearing disability in the United States with a correlation coefficient (R) of 0.792 and weighted average of 3.5%. Similarly, the statistical analysis conducted on geographies consisting of 473,961,057 people shows a mild positive correlation between the proportion of Danes and percentage of population with hearing disability in the United States with a correlation coefficient (R) of 0.393 and weighted average of 3.6%, a difference of 2.6%.
Hearing Disability Correlation Summary
| Measurement | Immigrants from North America | Danish |
| Minimum | 0.49% | 0.96% |
| Maximum | 60.0% | 49.1% |
| Range | 59.5% | 48.2% |
| Mean | 10.2% | 7.7% |
| Median | 7.0% | 4.9% |
| Interquartile 25% (IQ1) | 4.5% | 3.7% |
| Interquartile 75% (IQ3) | 11.0% | 7.1% |
| Interquartile Range (IQR) | 6.6% | 3.4% |
| Standard Deviation (Sample) | 11.5% | 9.5% |
| Standard Deviation (Population) | 11.3% | 9.5% |
Demographics Similar to Immigrants from North America and Danes by Hearing Disability
In terms of hearing disability, the demographic groups most similar to Immigrants from North America are Immigrants from Canada (3.5%, a difference of 0.040%), Hawaiian (3.5%, a difference of 0.11%), Portuguese (3.5%, a difference of 0.15%), Slovene (3.5%, a difference of 0.23%), and Immigrants from Germany (3.5%, a difference of 0.26%). Similarly, the demographic groups most similar to Danes are Czechoslovakian (3.6%, a difference of 0.12%), Swiss (3.5%, a difference of 0.32%), Puerto Rican (3.5%, a difference of 0.64%), Nonimmigrants (3.6%, a difference of 0.70%), and Fijian (3.5%, a difference of 0.72%).
| Demographics | Rating | Rank | Hearing Disability |
| Slovenes | 0.1 /100 | #259 | Tragic 3.5% |
| Portuguese | 0.1 /100 | #260 | Tragic 3.5% |
| Hawaiians | 0.1 /100 | #261 | Tragic 3.5% |
| Immigrants | North America | 0.1 /100 | #262 | Tragic 3.5% |
| Immigrants | Canada | 0.1 /100 | #263 | Tragic 3.5% |
| Immigrants | Germany | 0.1 /100 | #264 | Tragic 3.5% |
| British | 0.1 /100 | #265 | Tragic 3.5% |
| Belgians | 0.1 /100 | #266 | Tragic 3.5% |
| Canadians | 0.1 /100 | #267 | Tragic 3.5% |
| Spaniards | 0.1 /100 | #268 | Tragic 3.5% |
| Ute | 0.1 /100 | #269 | Tragic 3.5% |
| Europeans | 0.1 /100 | #270 | Tragic 3.5% |
| Czechs | 0.1 /100 | #271 | Tragic 3.5% |
| Fijians | 0.0 /100 | #272 | Tragic 3.5% |
| Puerto Ricans | 0.0 /100 | #273 | Tragic 3.5% |
| Swiss | 0.0 /100 | #274 | Tragic 3.5% |
| Czechoslovakians | 0.0 /100 | #275 | Tragic 3.6% |
| Danes | 0.0 /100 | #276 | Tragic 3.6% |
| Immigrants | Nonimmigrants | 0.0 /100 | #277 | Tragic 3.6% |
| Basques | 0.0 /100 | #278 | Tragic 3.6% |
| Slovaks | 0.0 /100 | #279 | Tragic 3.6% |