Immigrants from Nepal vs Immigrants from Kazakhstan Self-Care Disability
COMPARE
Immigrants from Nepal
Immigrants from Kazakhstan
Self-Care Disability
Self-Care Disability Comparison
Immigrants from Nepal
Immigrants from Kazakhstan
2.2%
SELF-CARE DISABILITY
100.0/ 100
METRIC RATING
9th/ 347
METRIC RANK
2.5%
SELF-CARE DISABILITY
46.7/ 100
METRIC RATING
177th/ 347
METRIC RANK
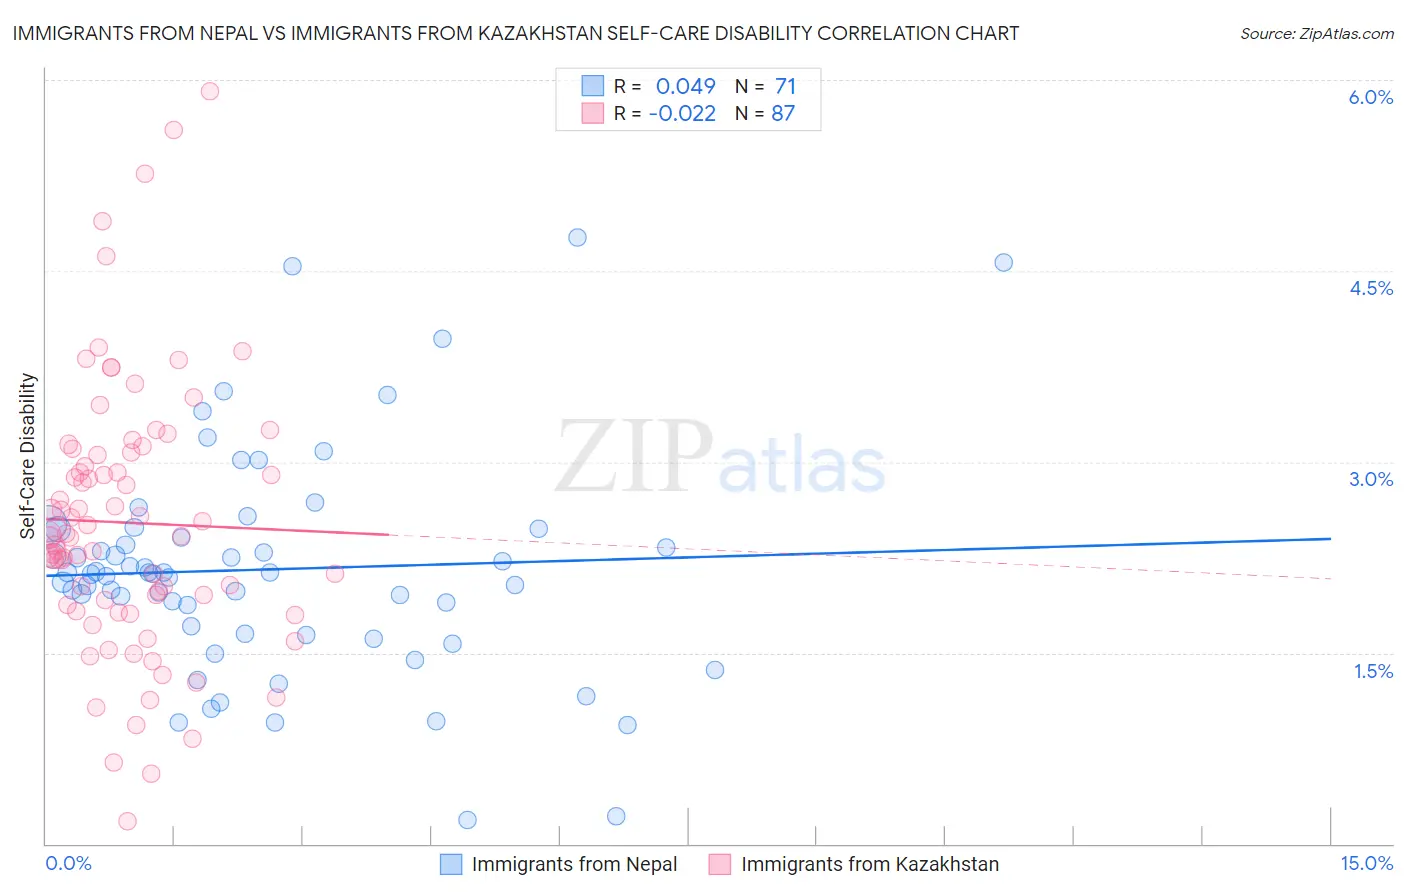
Immigrants from Nepal vs Immigrants from Kazakhstan Self-Care Disability Correlation Chart
The statistical analysis conducted on geographies consisting of 186,625,467 people shows no correlation between the proportion of Immigrants from Nepal and percentage of population with self-care disability in the United States with a correlation coefficient (R) of 0.049 and weighted average of 2.2%. Similarly, the statistical analysis conducted on geographies consisting of 124,334,513 people shows no correlation between the proportion of Immigrants from Kazakhstan and percentage of population with self-care disability in the United States with a correlation coefficient (R) of -0.022 and weighted average of 2.5%, a difference of 14.2%.
Self-Care Disability Correlation Summary
| Measurement | Immigrants from Nepal | Immigrants from Kazakhstan |
| Minimum | 0.19% | 0.18% |
| Maximum | 4.8% | 5.9% |
| Range | 4.6% | 5.7% |
| Mean | 2.2% | 2.5% |
| Median | 2.1% | 2.4% |
| Interquartile 25% (IQ1) | 1.7% | 1.9% |
| Interquartile 75% (IQ3) | 2.5% | 3.1% |
| Interquartile Range (IQR) | 0.82% | 1.2% |
| Standard Deviation (Sample) | 0.87% | 1.1% |
| Standard Deviation (Population) | 0.87% | 1.1% |
Similar Demographics by Self-Care Disability
Demographics Similar to Immigrants from Nepal by Self-Care Disability
In terms of self-care disability, the demographic groups most similar to Immigrants from Nepal are Bolivian (2.2%, a difference of 0.14%), Immigrants from Bolivia (2.2%, a difference of 0.18%), Filipino (2.2%, a difference of 0.39%), Zimbabwean (2.2%, a difference of 0.64%), and Sudanese (2.2%, a difference of 1.2%).
| Demographics | Rating | Rank | Self-Care Disability |
| Immigrants | India | 100.0 /100 | #2 | Exceptional 2.0% |
| Thais | 100.0 /100 | #3 | Exceptional 2.1% |
| Immigrants | Singapore | 100.0 /100 | #4 | Exceptional 2.1% |
| Zimbabweans | 100.0 /100 | #5 | Exceptional 2.2% |
| Filipinos | 100.0 /100 | #6 | Exceptional 2.2% |
| Immigrants | Bolivia | 100.0 /100 | #7 | Exceptional 2.2% |
| Bolivians | 100.0 /100 | #8 | Exceptional 2.2% |
| Immigrants | Nepal | 100.0 /100 | #9 | Exceptional 2.2% |
| Sudanese | 100.0 /100 | #10 | Exceptional 2.2% |
| Immigrants | South Central Asia | 100.0 /100 | #11 | Exceptional 2.2% |
| Immigrants | Ethiopia | 100.0 /100 | #12 | Exceptional 2.2% |
| Ethiopians | 100.0 /100 | #13 | Exceptional 2.2% |
| Luxembourgers | 100.0 /100 | #14 | Exceptional 2.2% |
| Okinawans | 100.0 /100 | #15 | Exceptional 2.2% |
| Immigrants | Kuwait | 100.0 /100 | #16 | Exceptional 2.2% |
Demographics Similar to Immigrants from Kazakhstan by Self-Care Disability
In terms of self-care disability, the demographic groups most similar to Immigrants from Kazakhstan are English (2.5%, a difference of 0.020%), Immigrants from Afghanistan (2.5%, a difference of 0.040%), Hungarian (2.5%, a difference of 0.060%), Immigrants from Bosnia and Herzegovina (2.5%, a difference of 0.14%), and Welsh (2.5%, a difference of 0.16%).
| Demographics | Rating | Rank | Self-Care Disability |
| Scottish | 54.3 /100 | #170 | Average 2.5% |
| Pennsylvania Germans | 53.5 /100 | #171 | Average 2.5% |
| Czechoslovakians | 53.5 /100 | #172 | Average 2.5% |
| Immigrants | Burma/Myanmar | 52.8 /100 | #173 | Average 2.5% |
| Welsh | 50.0 /100 | #174 | Average 2.5% |
| Immigrants | Bosnia and Herzegovina | 49.6 /100 | #175 | Average 2.5% |
| Immigrants | Afghanistan | 47.6 /100 | #176 | Average 2.5% |
| Immigrants | Kazakhstan | 46.7 /100 | #177 | Average 2.5% |
| English | 46.2 /100 | #178 | Average 2.5% |
| Hungarians | 45.5 /100 | #179 | Average 2.5% |
| Indonesians | 41.2 /100 | #180 | Average 2.5% |
| Ghanaians | 40.4 /100 | #181 | Average 2.5% |
| Maltese | 37.5 /100 | #182 | Fair 2.5% |
| Salvadorans | 36.4 /100 | #183 | Fair 2.5% |
| Yugoslavians | 36.1 /100 | #184 | Fair 2.5% |