Immigrants from Nepal vs Immigrants from Denmark Self-Care Disability
COMPARE
Immigrants from Nepal
Immigrants from Denmark
Self-Care Disability
Self-Care Disability Comparison
Immigrants from Nepal
Immigrants from Denmark
2.2%
SELF-CARE DISABILITY
100.0/ 100
METRIC RATING
9th/ 347
METRIC RANK
2.3%
SELF-CARE DISABILITY
98.8/ 100
METRIC RATING
82nd/ 347
METRIC RANK
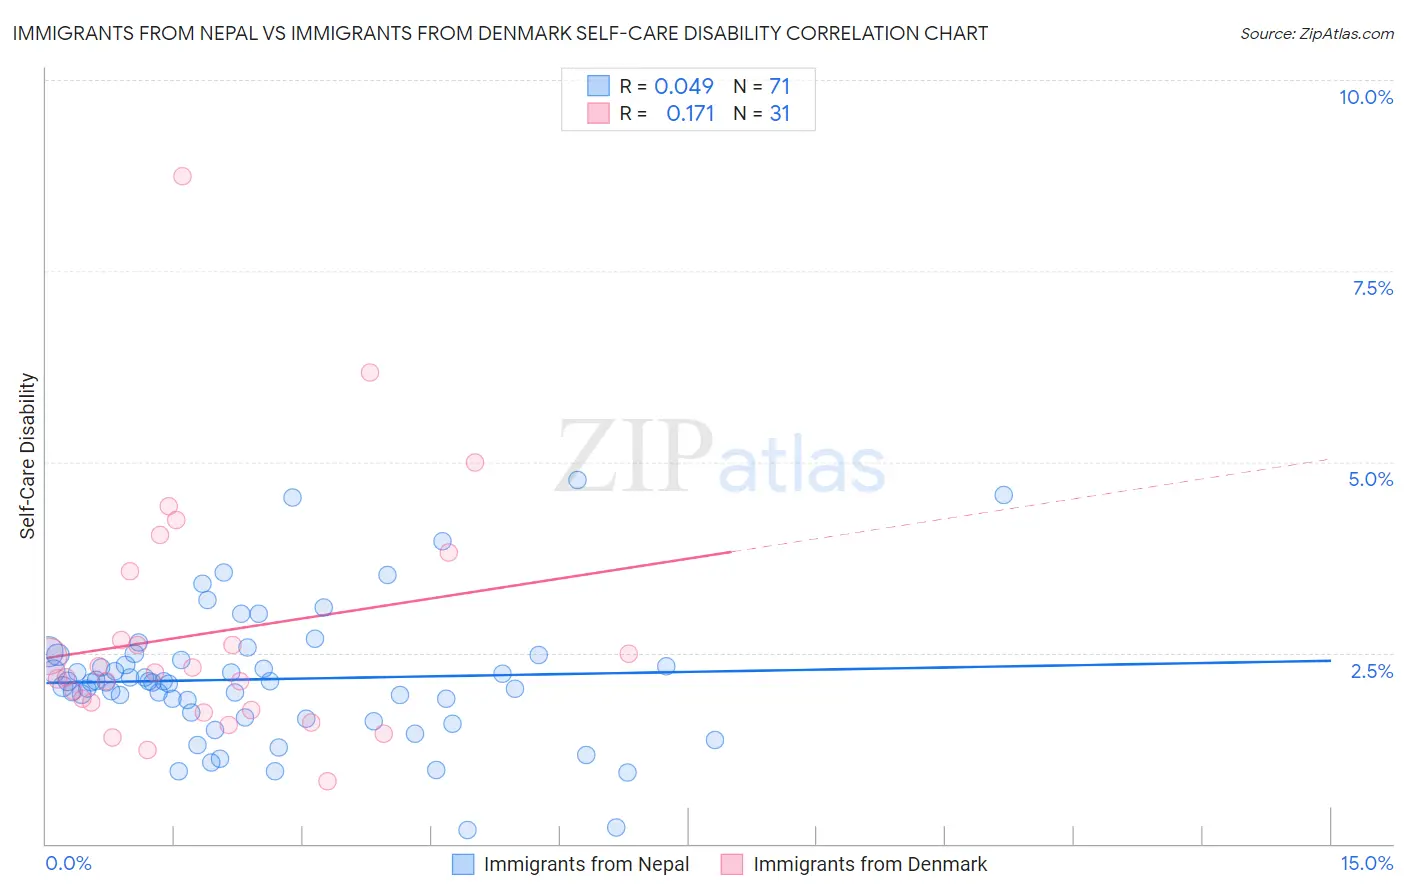
Immigrants from Nepal vs Immigrants from Denmark Self-Care Disability Correlation Chart
The statistical analysis conducted on geographies consisting of 186,625,467 people shows no correlation between the proportion of Immigrants from Nepal and percentage of population with self-care disability in the United States with a correlation coefficient (R) of 0.049 and weighted average of 2.2%. Similarly, the statistical analysis conducted on geographies consisting of 136,375,472 people shows a poor positive correlation between the proportion of Immigrants from Denmark and percentage of population with self-care disability in the United States with a correlation coefficient (R) of 0.171 and weighted average of 2.3%, a difference of 8.0%.
Self-Care Disability Correlation Summary
| Measurement | Immigrants from Nepal | Immigrants from Denmark |
| Minimum | 0.19% | 0.82% |
| Maximum | 4.8% | 8.7% |
| Range | 4.6% | 7.9% |
| Mean | 2.2% | 2.8% |
| Median | 2.1% | 2.2% |
| Interquartile 25% (IQ1) | 1.7% | 1.7% |
| Interquartile 75% (IQ3) | 2.5% | 3.6% |
| Interquartile Range (IQR) | 0.82% | 1.8% |
| Standard Deviation (Sample) | 0.87% | 1.6% |
| Standard Deviation (Population) | 0.87% | 1.6% |
Similar Demographics by Self-Care Disability
Demographics Similar to Immigrants from Nepal by Self-Care Disability
In terms of self-care disability, the demographic groups most similar to Immigrants from Nepal are Bolivian (2.2%, a difference of 0.14%), Immigrants from Bolivia (2.2%, a difference of 0.18%), Filipino (2.2%, a difference of 0.39%), Zimbabwean (2.2%, a difference of 0.64%), and Sudanese (2.2%, a difference of 1.2%).
| Demographics | Rating | Rank | Self-Care Disability |
| Immigrants | India | 100.0 /100 | #2 | Exceptional 2.0% |
| Thais | 100.0 /100 | #3 | Exceptional 2.1% |
| Immigrants | Singapore | 100.0 /100 | #4 | Exceptional 2.1% |
| Zimbabweans | 100.0 /100 | #5 | Exceptional 2.2% |
| Filipinos | 100.0 /100 | #6 | Exceptional 2.2% |
| Immigrants | Bolivia | 100.0 /100 | #7 | Exceptional 2.2% |
| Bolivians | 100.0 /100 | #8 | Exceptional 2.2% |
| Immigrants | Nepal | 100.0 /100 | #9 | Exceptional 2.2% |
| Sudanese | 100.0 /100 | #10 | Exceptional 2.2% |
| Immigrants | South Central Asia | 100.0 /100 | #11 | Exceptional 2.2% |
| Immigrants | Ethiopia | 100.0 /100 | #12 | Exceptional 2.2% |
| Ethiopians | 100.0 /100 | #13 | Exceptional 2.2% |
| Luxembourgers | 100.0 /100 | #14 | Exceptional 2.2% |
| Okinawans | 100.0 /100 | #15 | Exceptional 2.2% |
| Immigrants | Kuwait | 100.0 /100 | #16 | Exceptional 2.2% |
Demographics Similar to Immigrants from Denmark by Self-Care Disability
In terms of self-care disability, the demographic groups most similar to Immigrants from Denmark are Ugandan (2.3%, a difference of 0.0%), Chilean (2.3%, a difference of 0.070%), Indian (Asian) (2.3%, a difference of 0.070%), Immigrants from Spain (2.3%, a difference of 0.10%), and Immigrants from Middle Africa (2.3%, a difference of 0.26%).
| Demographics | Rating | Rank | Self-Care Disability |
| Immigrants | Netherlands | 99.1 /100 | #75 | Exceptional 2.3% |
| Immigrants | China | 99.1 /100 | #76 | Exceptional 2.3% |
| Immigrants | Middle Africa | 99.0 /100 | #77 | Exceptional 2.3% |
| Immigrants | Ireland | 99.0 /100 | #78 | Exceptional 2.3% |
| Immigrants | Kenya | 99.0 /100 | #79 | Exceptional 2.3% |
| Chileans | 98.8 /100 | #80 | Exceptional 2.3% |
| Ugandans | 98.8 /100 | #81 | Exceptional 2.3% |
| Immigrants | Denmark | 98.8 /100 | #82 | Exceptional 2.3% |
| Indians (Asian) | 98.7 /100 | #83 | Exceptional 2.3% |
| Immigrants | Spain | 98.7 /100 | #84 | Exceptional 2.3% |
| Estonians | 98.3 /100 | #85 | Exceptional 2.3% |
| Immigrants | Northern Africa | 98.2 /100 | #86 | Exceptional 2.3% |
| Sierra Leoneans | 98.0 /100 | #87 | Exceptional 2.4% |
| Lithuanians | 98.0 /100 | #88 | Exceptional 2.4% |
| Immigrants | Congo | 98.0 /100 | #89 | Exceptional 2.4% |