Immigrants from Nepal vs Immigrants from Japan Self-Care Disability
COMPARE
Immigrants from Nepal
Immigrants from Japan
Self-Care Disability
Self-Care Disability Comparison
Immigrants from Nepal
Immigrants from Japan
2.2%
SELF-CARE DISABILITY
100.0/ 100
METRIC RATING
9th/ 347
METRIC RANK
2.3%
SELF-CARE DISABILITY
99.5/ 100
METRIC RATING
60th/ 347
METRIC RANK
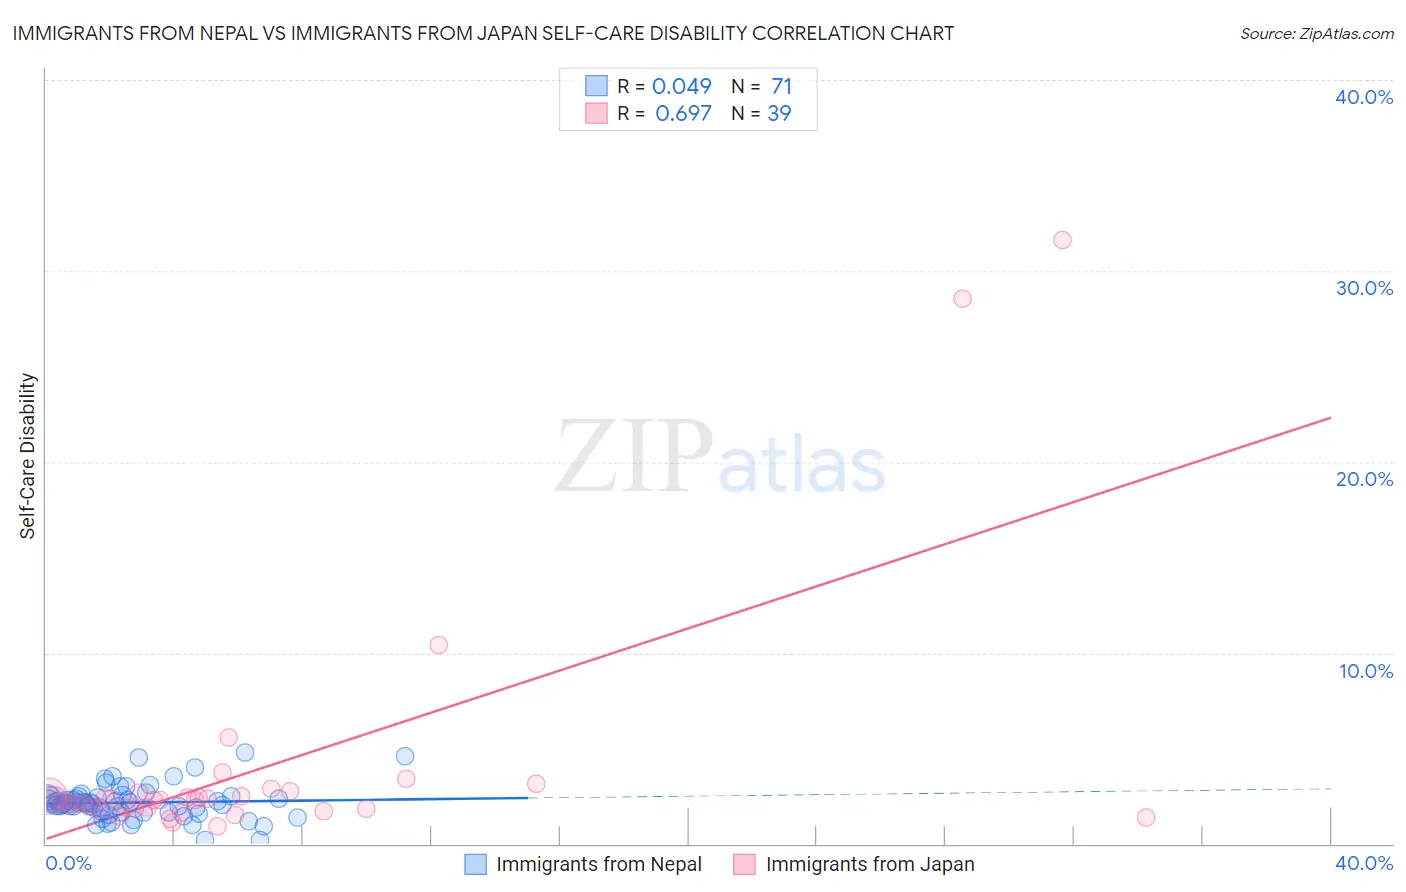
Immigrants from Nepal vs Immigrants from Japan Self-Care Disability Correlation Chart
The statistical analysis conducted on geographies consisting of 186,625,467 people shows no correlation between the proportion of Immigrants from Nepal and percentage of population with self-care disability in the United States with a correlation coefficient (R) of 0.049 and weighted average of 2.2%. Similarly, the statistical analysis conducted on geographies consisting of 339,768,160 people shows a significant positive correlation between the proportion of Immigrants from Japan and percentage of population with self-care disability in the United States with a correlation coefficient (R) of 0.697 and weighted average of 2.3%, a difference of 6.9%.
Self-Care Disability Correlation Summary
| Measurement | Immigrants from Nepal | Immigrants from Japan |
| Minimum | 0.19% | 0.90% |
| Maximum | 4.8% | 31.6% |
| Range | 4.6% | 30.7% |
| Mean | 2.2% | 3.9% |
| Median | 2.1% | 2.3% |
| Interquartile 25% (IQ1) | 1.7% | 1.8% |
| Interquartile 75% (IQ3) | 2.5% | 2.7% |
| Interquartile Range (IQR) | 0.82% | 0.86% |
| Standard Deviation (Sample) | 0.87% | 6.4% |
| Standard Deviation (Population) | 0.87% | 6.3% |
Similar Demographics by Self-Care Disability
Demographics Similar to Immigrants from Nepal by Self-Care Disability
In terms of self-care disability, the demographic groups most similar to Immigrants from Nepal are Bolivian (2.2%, a difference of 0.14%), Immigrants from Bolivia (2.2%, a difference of 0.18%), Filipino (2.2%, a difference of 0.39%), Zimbabwean (2.2%, a difference of 0.64%), and Sudanese (2.2%, a difference of 1.2%).
| Demographics | Rating | Rank | Self-Care Disability |
| Immigrants | India | 100.0 /100 | #2 | Exceptional 2.0% |
| Thais | 100.0 /100 | #3 | Exceptional 2.1% |
| Immigrants | Singapore | 100.0 /100 | #4 | Exceptional 2.1% |
| Zimbabweans | 100.0 /100 | #5 | Exceptional 2.2% |
| Filipinos | 100.0 /100 | #6 | Exceptional 2.2% |
| Immigrants | Bolivia | 100.0 /100 | #7 | Exceptional 2.2% |
| Bolivians | 100.0 /100 | #8 | Exceptional 2.2% |
| Immigrants | Nepal | 100.0 /100 | #9 | Exceptional 2.2% |
| Sudanese | 100.0 /100 | #10 | Exceptional 2.2% |
| Immigrants | South Central Asia | 100.0 /100 | #11 | Exceptional 2.2% |
| Immigrants | Ethiopia | 100.0 /100 | #12 | Exceptional 2.2% |
| Ethiopians | 100.0 /100 | #13 | Exceptional 2.2% |
| Luxembourgers | 100.0 /100 | #14 | Exceptional 2.2% |
| Okinawans | 100.0 /100 | #15 | Exceptional 2.2% |
| Immigrants | Kuwait | 100.0 /100 | #16 | Exceptional 2.2% |
Demographics Similar to Immigrants from Japan by Self-Care Disability
In terms of self-care disability, the demographic groups most similar to Immigrants from Japan are Palestinian (2.3%, a difference of 0.10%), New Zealander (2.3%, a difference of 0.14%), Egyptian (2.3%, a difference of 0.19%), Immigrants from Cameroon (2.3%, a difference of 0.25%), and Mongolian (2.3%, a difference of 0.27%).
| Demographics | Rating | Rank | Self-Care Disability |
| Australians | 99.6 /100 | #53 | Exceptional 2.3% |
| Argentineans | 99.6 /100 | #54 | Exceptional 2.3% |
| Immigrants | France | 99.6 /100 | #55 | Exceptional 2.3% |
| Immigrants | Eastern Asia | 99.6 /100 | #56 | Exceptional 2.3% |
| Immigrants | Belgium | 99.6 /100 | #57 | Exceptional 2.3% |
| Immigrants | Cameroon | 99.6 /100 | #58 | Exceptional 2.3% |
| New Zealanders | 99.5 /100 | #59 | Exceptional 2.3% |
| Immigrants | Japan | 99.5 /100 | #60 | Exceptional 2.3% |
| Palestinians | 99.4 /100 | #61 | Exceptional 2.3% |
| Egyptians | 99.4 /100 | #62 | Exceptional 2.3% |
| Mongolians | 99.3 /100 | #63 | Exceptional 2.3% |
| Swedes | 99.3 /100 | #64 | Exceptional 2.3% |
| Brazilians | 99.3 /100 | #65 | Exceptional 2.3% |
| Immigrants | Argentina | 99.3 /100 | #66 | Exceptional 2.3% |
| South Africans | 99.3 /100 | #67 | Exceptional 2.3% |