Immigrants from Nepal vs Creek Self-Care Disability
COMPARE
Immigrants from Nepal
Creek
Self-Care Disability
Self-Care Disability Comparison
Immigrants from Nepal
Creek
2.2%
SELF-CARE DISABILITY
100.0/ 100
METRIC RATING
9th/ 347
METRIC RANK
2.8%
SELF-CARE DISABILITY
0.0/ 100
METRIC RATING
314th/ 347
METRIC RANK
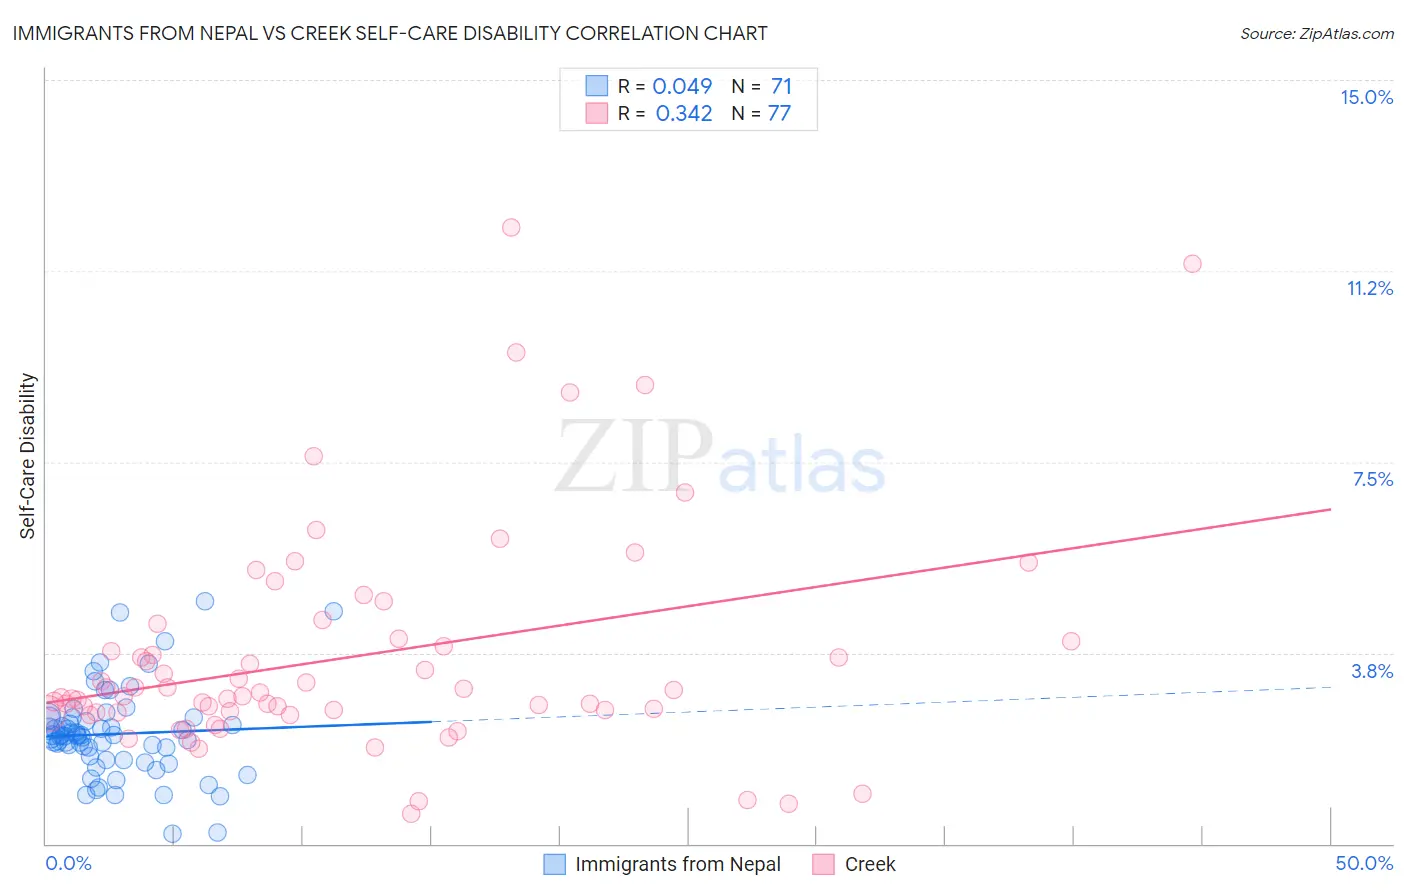
Immigrants from Nepal vs Creek Self-Care Disability Correlation Chart
The statistical analysis conducted on geographies consisting of 186,625,467 people shows no correlation between the proportion of Immigrants from Nepal and percentage of population with self-care disability in the United States with a correlation coefficient (R) of 0.049 and weighted average of 2.2%. Similarly, the statistical analysis conducted on geographies consisting of 178,379,870 people shows a mild positive correlation between the proportion of Creek and percentage of population with self-care disability in the United States with a correlation coefficient (R) of 0.342 and weighted average of 2.8%, a difference of 31.0%.
Self-Care Disability Correlation Summary
| Measurement | Immigrants from Nepal | Creek |
| Minimum | 0.19% | 0.58% |
| Maximum | 4.8% | 12.1% |
| Range | 4.6% | 11.5% |
| Mean | 2.2% | 3.7% |
| Median | 2.1% | 2.9% |
| Interquartile 25% (IQ1) | 1.7% | 2.6% |
| Interquartile 75% (IQ3) | 2.5% | 4.0% |
| Interquartile Range (IQR) | 0.82% | 1.4% |
| Standard Deviation (Sample) | 0.87% | 2.2% |
| Standard Deviation (Population) | 0.87% | 2.2% |
Similar Demographics by Self-Care Disability
Demographics Similar to Immigrants from Nepal by Self-Care Disability
In terms of self-care disability, the demographic groups most similar to Immigrants from Nepal are Bolivian (2.2%, a difference of 0.14%), Immigrants from Bolivia (2.2%, a difference of 0.18%), Filipino (2.2%, a difference of 0.39%), Zimbabwean (2.2%, a difference of 0.64%), and Sudanese (2.2%, a difference of 1.2%).
| Demographics | Rating | Rank | Self-Care Disability |
| Immigrants | India | 100.0 /100 | #2 | Exceptional 2.0% |
| Thais | 100.0 /100 | #3 | Exceptional 2.1% |
| Immigrants | Singapore | 100.0 /100 | #4 | Exceptional 2.1% |
| Zimbabweans | 100.0 /100 | #5 | Exceptional 2.2% |
| Filipinos | 100.0 /100 | #6 | Exceptional 2.2% |
| Immigrants | Bolivia | 100.0 /100 | #7 | Exceptional 2.2% |
| Bolivians | 100.0 /100 | #8 | Exceptional 2.2% |
| Immigrants | Nepal | 100.0 /100 | #9 | Exceptional 2.2% |
| Sudanese | 100.0 /100 | #10 | Exceptional 2.2% |
| Immigrants | South Central Asia | 100.0 /100 | #11 | Exceptional 2.2% |
| Immigrants | Ethiopia | 100.0 /100 | #12 | Exceptional 2.2% |
| Ethiopians | 100.0 /100 | #13 | Exceptional 2.2% |
| Luxembourgers | 100.0 /100 | #14 | Exceptional 2.2% |
| Okinawans | 100.0 /100 | #15 | Exceptional 2.2% |
| Immigrants | Kuwait | 100.0 /100 | #16 | Exceptional 2.2% |
Demographics Similar to Creek by Self-Care Disability
In terms of self-care disability, the demographic groups most similar to Creek are Immigrants from Cuba (2.8%, a difference of 0.21%), Spanish American (2.8%, a difference of 0.22%), Immigrants from Caribbean (2.8%, a difference of 0.25%), Menominee (2.8%, a difference of 0.32%), and Immigrants from Dominica (2.8%, a difference of 0.44%).
| Demographics | Rating | Rank | Self-Care Disability |
| Natives/Alaskans | 0.0 /100 | #307 | Tragic 2.8% |
| Immigrants | Grenada | 0.0 /100 | #308 | Tragic 2.8% |
| Bangladeshis | 0.0 /100 | #309 | Tragic 2.8% |
| British West Indians | 0.0 /100 | #310 | Tragic 2.8% |
| Puget Sound Salish | 0.0 /100 | #311 | Tragic 2.8% |
| Immigrants | Caribbean | 0.0 /100 | #312 | Tragic 2.8% |
| Spanish Americans | 0.0 /100 | #313 | Tragic 2.8% |
| Creek | 0.0 /100 | #314 | Tragic 2.8% |
| Immigrants | Cuba | 0.0 /100 | #315 | Tragic 2.8% |
| Menominee | 0.0 /100 | #316 | Tragic 2.8% |
| Immigrants | Dominica | 0.0 /100 | #317 | Tragic 2.8% |
| Assyrians/Chaldeans/Syriacs | 0.0 /100 | #318 | Tragic 2.8% |
| Spanish American Indians | 0.0 /100 | #319 | Tragic 2.9% |
| Chickasaw | 0.0 /100 | #320 | Tragic 2.9% |
| Navajo | 0.0 /100 | #321 | Tragic 2.9% |