Immigrants from Micronesia vs Polish Disability
COMPARE
Immigrants from Micronesia
Polish
Disability
Disability Comparison
Immigrants from Micronesia
Poles
13.2%
DISABILITY
0.0/ 100
METRIC RATING
301st/ 347
METRIC RANK
12.2%
DISABILITY
1.7/ 100
METRIC RATING
242nd/ 347
METRIC RANK
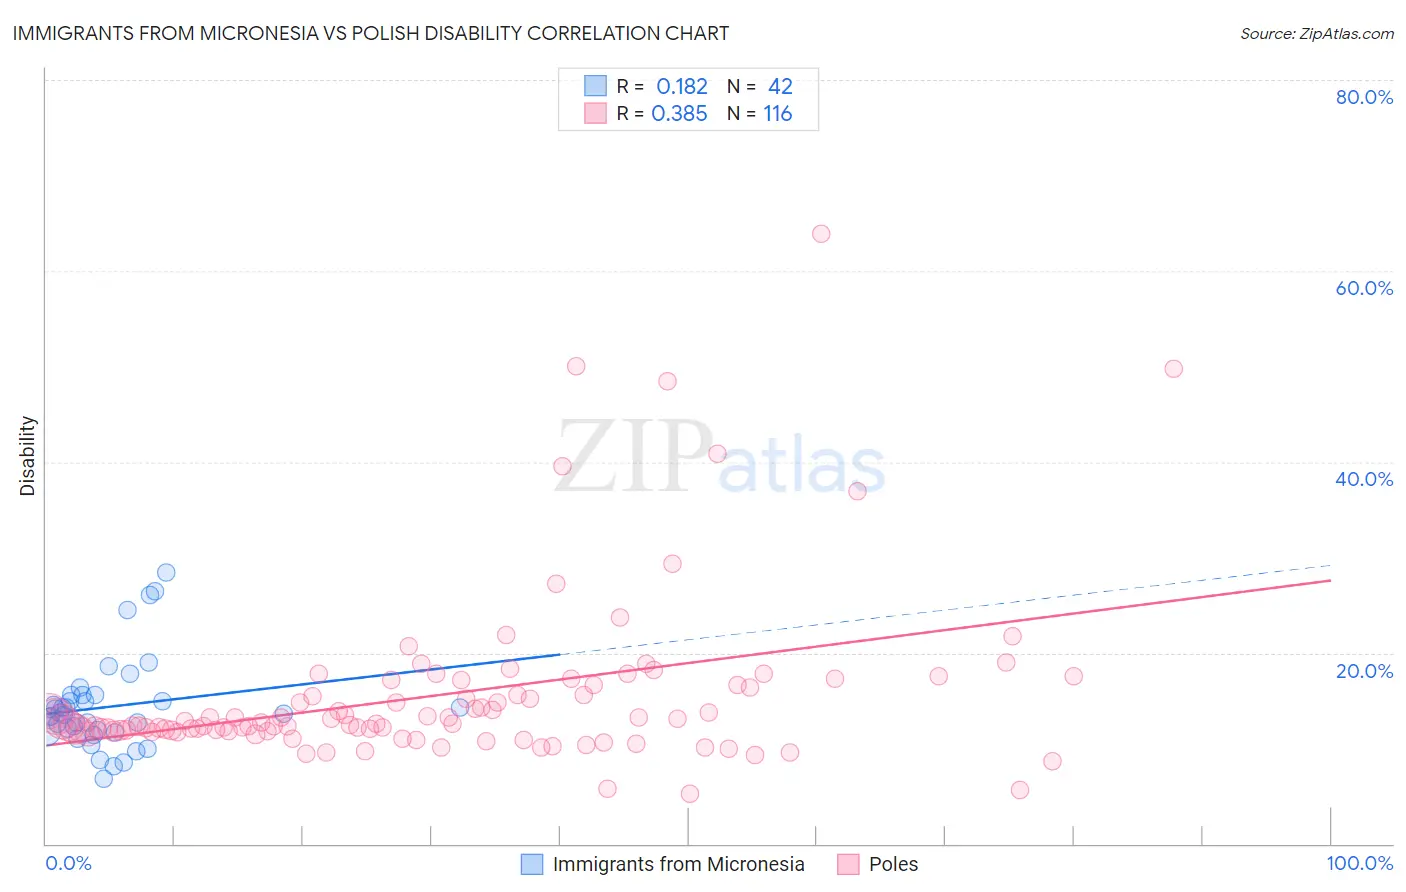
Immigrants from Micronesia vs Polish Disability Correlation Chart
The statistical analysis conducted on geographies consisting of 61,603,452 people shows a poor positive correlation between the proportion of Immigrants from Micronesia and percentage of population with a disability in the United States with a correlation coefficient (R) of 0.182 and weighted average of 13.2%. Similarly, the statistical analysis conducted on geographies consisting of 560,456,636 people shows a mild positive correlation between the proportion of Poles and percentage of population with a disability in the United States with a correlation coefficient (R) of 0.385 and weighted average of 12.2%, a difference of 7.8%.
Disability Correlation Summary
| Measurement | Immigrants from Micronesia | Polish |
| Minimum | 6.8% | 5.3% |
| Maximum | 28.4% | 63.9% |
| Range | 21.6% | 58.6% |
| Mean | 14.3% | 15.6% |
| Median | 13.6% | 12.7% |
| Interquartile 25% (IQ1) | 11.8% | 11.8% |
| Interquartile 75% (IQ3) | 15.6% | 16.6% |
| Interquartile Range (IQR) | 3.8% | 4.8% |
| Standard Deviation (Sample) | 4.7% | 9.1% |
| Standard Deviation (Population) | 4.7% | 9.0% |
Similar Demographics by Disability
Demographics Similar to Immigrants from Micronesia by Disability
In terms of disability, the demographic groups most similar to Immigrants from Micronesia are Pennsylvania German (13.2%, a difference of 0.090%), French (13.2%, a difference of 0.13%), Alaska Native (13.2%, a difference of 0.15%), Hopi (13.2%, a difference of 0.16%), and Arapaho (13.2%, a difference of 0.21%).
| Demographics | Rating | Rank | Disability |
| Celtics | 0.0 /100 | #294 | Tragic 13.1% |
| Immigrants | Nonimmigrants | 0.0 /100 | #295 | Tragic 13.2% |
| Central American Indians | 0.0 /100 | #296 | Tragic 13.2% |
| Hopi | 0.0 /100 | #297 | Tragic 13.2% |
| Alaska Natives | 0.0 /100 | #298 | Tragic 13.2% |
| French | 0.0 /100 | #299 | Tragic 13.2% |
| Pennsylvania Germans | 0.0 /100 | #300 | Tragic 13.2% |
| Immigrants | Micronesia | 0.0 /100 | #301 | Tragic 13.2% |
| Arapaho | 0.0 /100 | #302 | Tragic 13.2% |
| Scotch-Irish | 0.0 /100 | #303 | Tragic 13.3% |
| Yakama | 0.0 /100 | #304 | Tragic 13.4% |
| French Canadians | 0.0 /100 | #305 | Tragic 13.4% |
| Cape Verdeans | 0.0 /100 | #306 | Tragic 13.5% |
| Shoshone | 0.0 /100 | #307 | Tragic 13.5% |
| French American Indians | 0.0 /100 | #308 | Tragic 13.5% |
Demographics Similar to Poles by Disability
In terms of disability, the demographic groups most similar to Poles are Hungarian (12.2%, a difference of 0.020%), Yugoslavian (12.2%, a difference of 0.020%), Swedish (12.2%, a difference of 0.080%), British (12.2%, a difference of 0.090%), and Basque (12.2%, a difference of 0.090%).
| Demographics | Rating | Rank | Disability |
| Yup'ik | 2.2 /100 | #235 | Tragic 12.2% |
| Chinese | 2.0 /100 | #236 | Tragic 12.2% |
| Immigrants | Congo | 1.9 /100 | #237 | Tragic 12.2% |
| Norwegians | 1.9 /100 | #238 | Tragic 12.2% |
| Swedes | 1.8 /100 | #239 | Tragic 12.2% |
| Hungarians | 1.7 /100 | #240 | Tragic 12.2% |
| Yugoslavians | 1.7 /100 | #241 | Tragic 12.2% |
| Poles | 1.7 /100 | #242 | Tragic 12.2% |
| British | 1.5 /100 | #243 | Tragic 12.2% |
| Basques | 1.5 /100 | #244 | Tragic 12.2% |
| Liberians | 1.5 /100 | #245 | Tragic 12.2% |
| Swiss | 1.5 /100 | #246 | Tragic 12.2% |
| Indonesians | 1.4 /100 | #247 | Tragic 12.2% |
| Guamanians/Chamorros | 1.4 /100 | #248 | Tragic 12.3% |
| Carpatho Rusyns | 1.4 /100 | #249 | Tragic 12.3% |