Immigrants from Morocco vs Polish Disability
COMPARE
Immigrants from Morocco
Polish
Disability
Disability Comparison
Immigrants from Morocco
Poles
11.2%
DISABILITY
97.8/ 100
METRIC RATING
94th/ 347
METRIC RANK
12.2%
DISABILITY
1.7/ 100
METRIC RATING
242nd/ 347
METRIC RANK
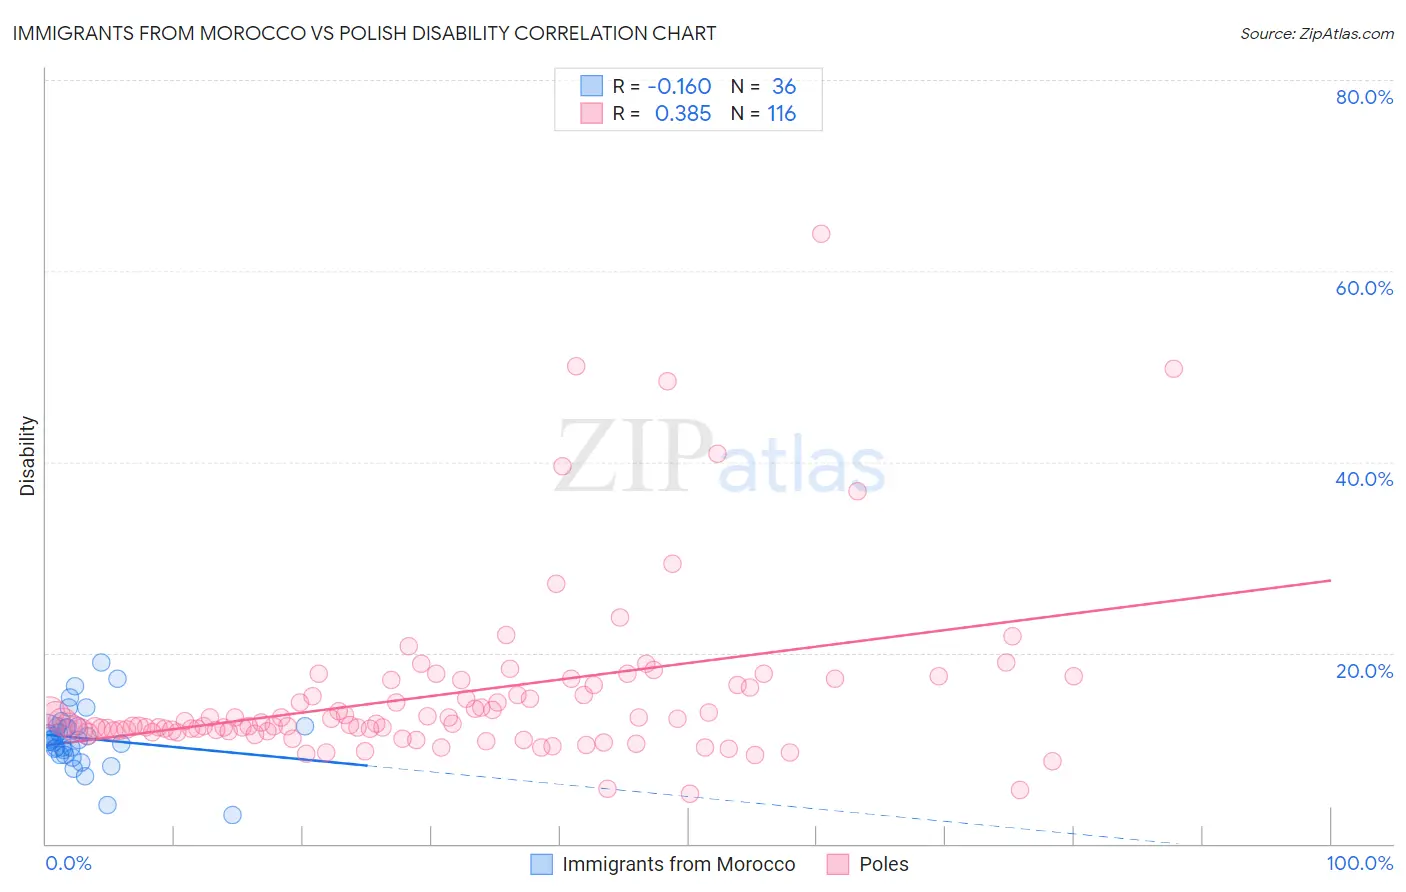
Immigrants from Morocco vs Polish Disability Correlation Chart
The statistical analysis conducted on geographies consisting of 178,910,463 people shows a poor negative correlation between the proportion of Immigrants from Morocco and percentage of population with a disability in the United States with a correlation coefficient (R) of -0.160 and weighted average of 11.2%. Similarly, the statistical analysis conducted on geographies consisting of 560,456,636 people shows a mild positive correlation between the proportion of Poles and percentage of population with a disability in the United States with a correlation coefficient (R) of 0.385 and weighted average of 12.2%, a difference of 9.1%.
Disability Correlation Summary
| Measurement | Immigrants from Morocco | Polish |
| Minimum | 3.0% | 5.3% |
| Maximum | 18.9% | 63.9% |
| Range | 15.9% | 58.6% |
| Mean | 11.0% | 15.6% |
| Median | 10.9% | 12.7% |
| Interquartile 25% (IQ1) | 9.6% | 11.8% |
| Interquartile 75% (IQ3) | 12.2% | 16.6% |
| Interquartile Range (IQR) | 2.7% | 4.8% |
| Standard Deviation (Sample) | 3.2% | 9.1% |
| Standard Deviation (Population) | 3.1% | 9.0% |
Similar Demographics by Disability
Demographics Similar to Immigrants from Morocco by Disability
In terms of disability, the demographic groups most similar to Immigrants from Morocco are Eastern European (11.2%, a difference of 0.010%), Immigrants from Zimbabwe (11.2%, a difference of 0.070%), Ecuadorian (11.2%, a difference of 0.12%), Immigrants from Ecuador (11.2%, a difference of 0.12%), and Immigrants from Western Asia (11.2%, a difference of 0.16%).
| Demographics | Rating | Rank | Disability |
| Palestinians | 98.9 /100 | #87 | Exceptional 11.1% |
| Immigrants | Romania | 98.5 /100 | #88 | Exceptional 11.2% |
| Immigrants | South Africa | 98.2 /100 | #89 | Exceptional 11.2% |
| Immigrants | Brazil | 98.1 /100 | #90 | Exceptional 11.2% |
| Immigrants | Western Asia | 98.1 /100 | #91 | Exceptional 11.2% |
| Ecuadorians | 98.0 /100 | #92 | Exceptional 11.2% |
| Immigrants | Ecuador | 98.0 /100 | #93 | Exceptional 11.2% |
| Immigrants | Morocco | 97.8 /100 | #94 | Exceptional 11.2% |
| Eastern Europeans | 97.8 /100 | #95 | Exceptional 11.2% |
| Immigrants | Zimbabwe | 97.7 /100 | #96 | Exceptional 11.2% |
| Bhutanese | 97.4 /100 | #97 | Exceptional 11.2% |
| Uruguayans | 97.4 /100 | #98 | Exceptional 11.2% |
| Immigrants | Czechoslovakia | 97.4 /100 | #99 | Exceptional 11.2% |
| Immigrants | Greece | 96.9 /100 | #100 | Exceptional 11.3% |
| Immigrants | Nicaragua | 96.8 /100 | #101 | Exceptional 11.3% |
Demographics Similar to Poles by Disability
In terms of disability, the demographic groups most similar to Poles are Hungarian (12.2%, a difference of 0.020%), Yugoslavian (12.2%, a difference of 0.020%), Swedish (12.2%, a difference of 0.080%), British (12.2%, a difference of 0.090%), and Basque (12.2%, a difference of 0.090%).
| Demographics | Rating | Rank | Disability |
| Yup'ik | 2.2 /100 | #235 | Tragic 12.2% |
| Chinese | 2.0 /100 | #236 | Tragic 12.2% |
| Immigrants | Congo | 1.9 /100 | #237 | Tragic 12.2% |
| Norwegians | 1.9 /100 | #238 | Tragic 12.2% |
| Swedes | 1.8 /100 | #239 | Tragic 12.2% |
| Hungarians | 1.7 /100 | #240 | Tragic 12.2% |
| Yugoslavians | 1.7 /100 | #241 | Tragic 12.2% |
| Poles | 1.7 /100 | #242 | Tragic 12.2% |
| British | 1.5 /100 | #243 | Tragic 12.2% |
| Basques | 1.5 /100 | #244 | Tragic 12.2% |
| Liberians | 1.5 /100 | #245 | Tragic 12.2% |
| Swiss | 1.5 /100 | #246 | Tragic 12.2% |
| Indonesians | 1.4 /100 | #247 | Tragic 12.2% |
| Guamanians/Chamorros | 1.4 /100 | #248 | Tragic 12.3% |
| Carpatho Rusyns | 1.4 /100 | #249 | Tragic 12.3% |