Immigrants from Micronesia vs Immigrants from Portugal Disability
COMPARE
Immigrants from Micronesia
Immigrants from Portugal
Disability
Disability Comparison
Immigrants from Micronesia
Immigrants from Portugal
13.2%
DISABILITY
0.0/ 100
METRIC RATING
301st/ 347
METRIC RANK
12.9%
DISABILITY
0.0/ 100
METRIC RATING
281st/ 347
METRIC RANK
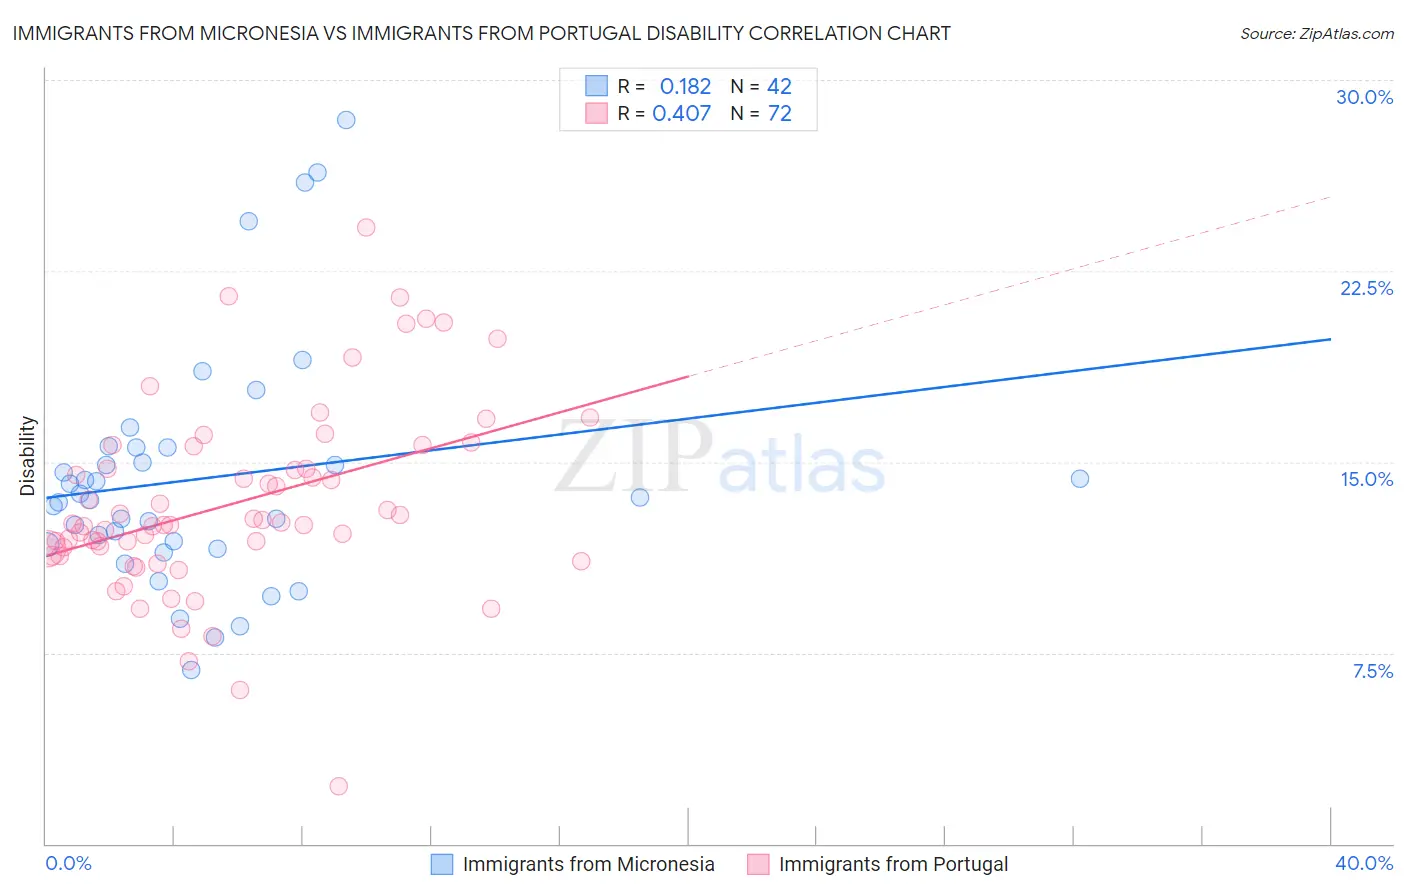
Immigrants from Micronesia vs Immigrants from Portugal Disability Correlation Chart
The statistical analysis conducted on geographies consisting of 61,603,452 people shows a poor positive correlation between the proportion of Immigrants from Micronesia and percentage of population with a disability in the United States with a correlation coefficient (R) of 0.182 and weighted average of 13.2%. Similarly, the statistical analysis conducted on geographies consisting of 174,786,483 people shows a moderate positive correlation between the proportion of Immigrants from Portugal and percentage of population with a disability in the United States with a correlation coefficient (R) of 0.407 and weighted average of 12.9%, a difference of 2.5%.
Disability Correlation Summary
| Measurement | Immigrants from Micronesia | Immigrants from Portugal |
| Minimum | 6.8% | 2.3% |
| Maximum | 28.4% | 24.2% |
| Range | 21.6% | 21.9% |
| Mean | 14.3% | 13.4% |
| Median | 13.6% | 12.6% |
| Interquartile 25% (IQ1) | 11.8% | 11.4% |
| Interquartile 75% (IQ3) | 15.6% | 15.2% |
| Interquartile Range (IQR) | 3.8% | 3.7% |
| Standard Deviation (Sample) | 4.7% | 3.8% |
| Standard Deviation (Population) | 4.7% | 3.7% |
Demographics Similar to Immigrants from Micronesia and Immigrants from Portugal by Disability
In terms of disability, the demographic groups most similar to Immigrants from Micronesia are Pennsylvania German (13.2%, a difference of 0.090%), French (13.2%, a difference of 0.13%), Alaska Native (13.2%, a difference of 0.15%), Hopi (13.2%, a difference of 0.16%), and Central American Indian (13.2%, a difference of 0.22%). Similarly, the demographic groups most similar to Immigrants from Portugal are Scottish (12.9%, a difference of 0.14%), Irish (12.9%, a difference of 0.16%), Welsh (12.9%, a difference of 0.36%), Crow (12.9%, a difference of 0.36%), and English (13.0%, a difference of 0.74%).
| Demographics | Rating | Rank | Disability |
| Immigrants | Portugal | 0.0 /100 | #281 | Tragic 12.9% |
| Scottish | 0.0 /100 | #282 | Tragic 12.9% |
| Irish | 0.0 /100 | #283 | Tragic 12.9% |
| Welsh | 0.0 /100 | #284 | Tragic 12.9% |
| Crow | 0.0 /100 | #285 | Tragic 12.9% |
| English | 0.0 /100 | #286 | Tragic 13.0% |
| Africans | 0.0 /100 | #287 | Tragic 13.0% |
| Whites/Caucasians | 0.0 /100 | #288 | Tragic 13.0% |
| Slovaks | 0.0 /100 | #289 | Tragic 13.0% |
| Cheyenne | 0.0 /100 | #290 | Tragic 13.0% |
| Yaqui | 0.0 /100 | #291 | Tragic 13.1% |
| Aleuts | 0.0 /100 | #292 | Tragic 13.1% |
| Marshallese | 0.0 /100 | #293 | Tragic 13.1% |
| Celtics | 0.0 /100 | #294 | Tragic 13.1% |
| Immigrants | Nonimmigrants | 0.0 /100 | #295 | Tragic 13.2% |
| Central American Indians | 0.0 /100 | #296 | Tragic 13.2% |
| Hopi | 0.0 /100 | #297 | Tragic 13.2% |
| Alaska Natives | 0.0 /100 | #298 | Tragic 13.2% |
| French | 0.0 /100 | #299 | Tragic 13.2% |
| Pennsylvania Germans | 0.0 /100 | #300 | Tragic 13.2% |
| Immigrants | Micronesia | 0.0 /100 | #301 | Tragic 13.2% |