Immigrants from Micronesia vs Belizean Disability
COMPARE
Immigrants from Micronesia
Belizean
Disability
Disability Comparison
Immigrants from Micronesia
Belizeans
13.2%
DISABILITY
0.0/ 100
METRIC RATING
301st/ 347
METRIC RANK
11.9%
DISABILITY
12.8/ 100
METRIC RATING
200th/ 347
METRIC RANK
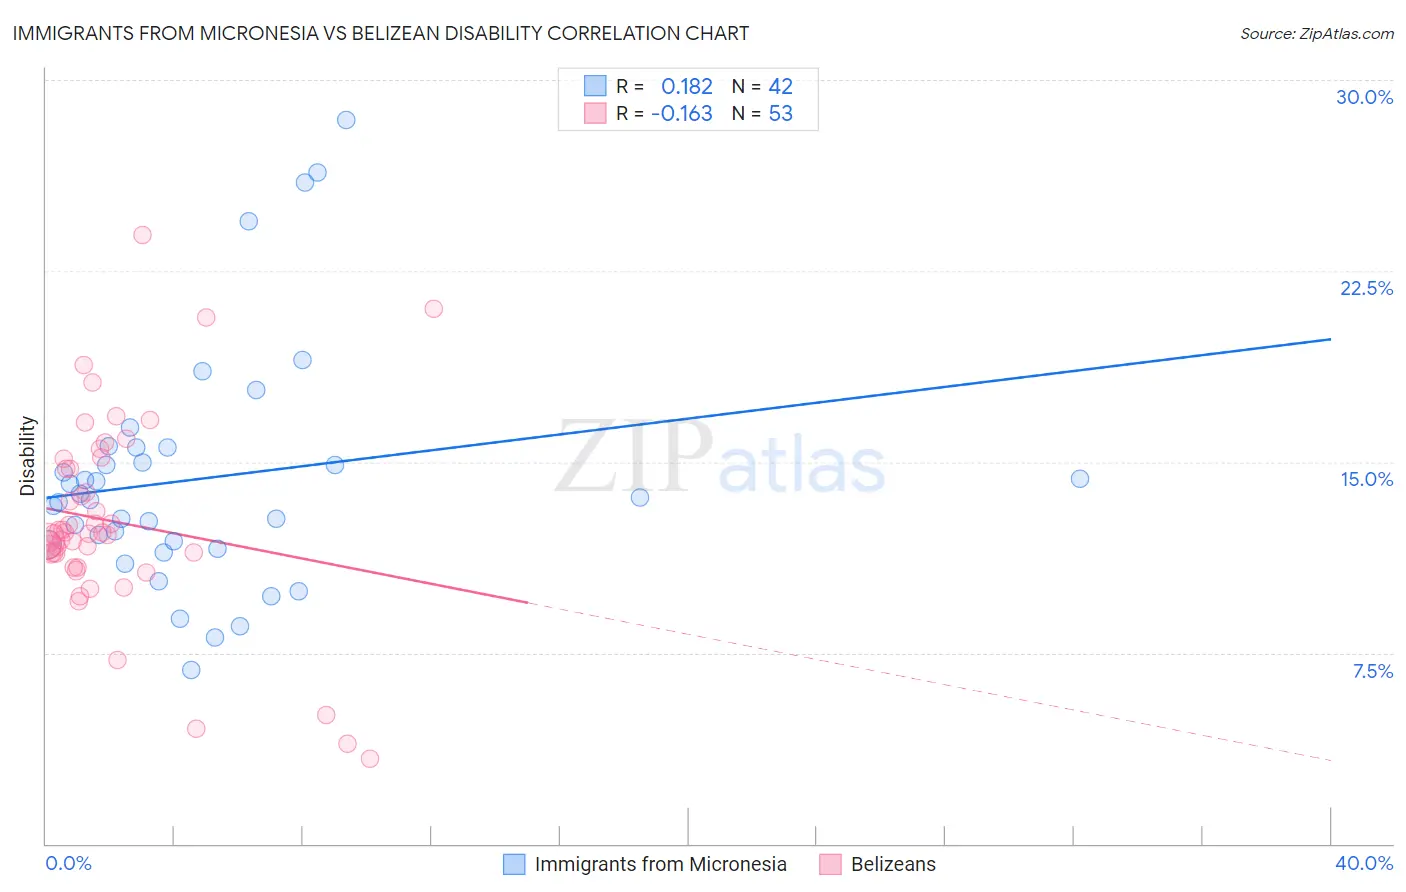
Immigrants from Micronesia vs Belizean Disability Correlation Chart
The statistical analysis conducted on geographies consisting of 61,603,452 people shows a poor positive correlation between the proportion of Immigrants from Micronesia and percentage of population with a disability in the United States with a correlation coefficient (R) of 0.182 and weighted average of 13.2%. Similarly, the statistical analysis conducted on geographies consisting of 144,197,719 people shows a poor negative correlation between the proportion of Belizeans and percentage of population with a disability in the United States with a correlation coefficient (R) of -0.163 and weighted average of 11.9%, a difference of 10.4%.
Disability Correlation Summary
| Measurement | Immigrants from Micronesia | Belizean |
| Minimum | 6.8% | 3.4% |
| Maximum | 28.4% | 23.9% |
| Range | 21.6% | 20.5% |
| Mean | 14.3% | 12.7% |
| Median | 13.6% | 12.2% |
| Interquartile 25% (IQ1) | 11.8% | 11.1% |
| Interquartile 75% (IQ3) | 15.6% | 14.9% |
| Interquartile Range (IQR) | 3.8% | 3.8% |
| Standard Deviation (Sample) | 4.7% | 3.9% |
| Standard Deviation (Population) | 4.7% | 3.9% |
Similar Demographics by Disability
Demographics Similar to Immigrants from Micronesia by Disability
In terms of disability, the demographic groups most similar to Immigrants from Micronesia are Pennsylvania German (13.2%, a difference of 0.090%), French (13.2%, a difference of 0.13%), Alaska Native (13.2%, a difference of 0.15%), Hopi (13.2%, a difference of 0.16%), and Arapaho (13.2%, a difference of 0.21%).
| Demographics | Rating | Rank | Disability |
| Celtics | 0.0 /100 | #294 | Tragic 13.1% |
| Immigrants | Nonimmigrants | 0.0 /100 | #295 | Tragic 13.2% |
| Central American Indians | 0.0 /100 | #296 | Tragic 13.2% |
| Hopi | 0.0 /100 | #297 | Tragic 13.2% |
| Alaska Natives | 0.0 /100 | #298 | Tragic 13.2% |
| French | 0.0 /100 | #299 | Tragic 13.2% |
| Pennsylvania Germans | 0.0 /100 | #300 | Tragic 13.2% |
| Immigrants | Micronesia | 0.0 /100 | #301 | Tragic 13.2% |
| Arapaho | 0.0 /100 | #302 | Tragic 13.2% |
| Scotch-Irish | 0.0 /100 | #303 | Tragic 13.3% |
| Yakama | 0.0 /100 | #304 | Tragic 13.4% |
| French Canadians | 0.0 /100 | #305 | Tragic 13.4% |
| Cape Verdeans | 0.0 /100 | #306 | Tragic 13.5% |
| Shoshone | 0.0 /100 | #307 | Tragic 13.5% |
| French American Indians | 0.0 /100 | #308 | Tragic 13.5% |
Demographics Similar to Belizeans by Disability
In terms of disability, the demographic groups most similar to Belizeans are Assyrian/Chaldean/Syriac (11.9%, a difference of 0.020%), Immigrants from England (12.0%, a difference of 0.090%), British West Indian (12.0%, a difference of 0.14%), Mexican American Indian (12.0%, a difference of 0.14%), and Immigrants from Panama (11.9%, a difference of 0.16%).
| Demographics | Rating | Rank | Disability |
| Immigrants | Bosnia and Herzegovina | 18.0 /100 | #193 | Poor 11.9% |
| Somalis | 17.3 /100 | #194 | Poor 11.9% |
| Barbadians | 15.8 /100 | #195 | Poor 11.9% |
| Serbians | 15.4 /100 | #196 | Poor 11.9% |
| Immigrants | Belize | 15.2 /100 | #197 | Poor 11.9% |
| Ukrainians | 14.7 /100 | #198 | Poor 11.9% |
| Immigrants | Panama | 14.6 /100 | #199 | Poor 11.9% |
| Belizeans | 12.8 /100 | #200 | Poor 11.9% |
| Assyrians/Chaldeans/Syriacs | 12.6 /100 | #201 | Poor 11.9% |
| Immigrants | England | 12.0 /100 | #202 | Poor 12.0% |
| British West Indians | 11.5 /100 | #203 | Poor 12.0% |
| Mexican American Indians | 11.4 /100 | #204 | Poor 12.0% |
| Immigrants | Western Europe | 10.1 /100 | #205 | Poor 12.0% |
| Immigrants | Senegal | 9.4 /100 | #206 | Tragic 12.0% |
| Immigrants | Thailand | 9.3 /100 | #207 | Tragic 12.0% |