Immigrants from Micronesia vs Polish Unemployment Among Ages 20 to 24 years
COMPARE
Immigrants from Micronesia
Polish
Unemployment Among Ages 20 to 24 years
Unemployment Among Ages 20 to 24 years Comparison
Immigrants from Micronesia
Poles
10.0%
UNEMPLOYMENT AMONG AGES 20 TO 24 YEARS
96.6/ 100
METRIC RATING
94th/ 347
METRIC RANK
10.0%
UNEMPLOYMENT AMONG AGES 20 TO 24 YEARS
97.1/ 100
METRIC RATING
88th/ 347
METRIC RANK
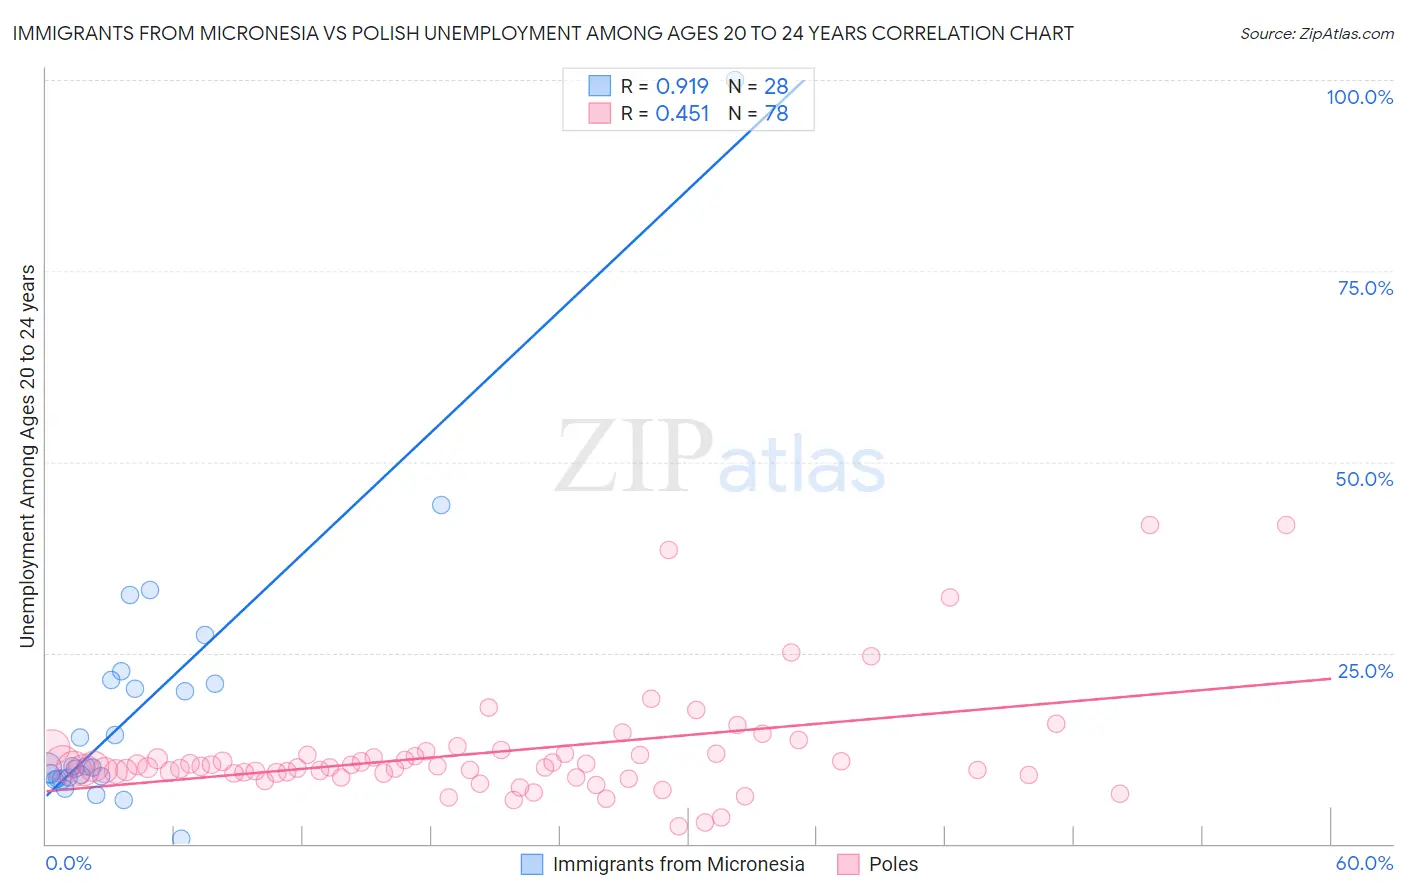
Immigrants from Micronesia vs Polish Unemployment Among Ages 20 to 24 years Correlation Chart
The statistical analysis conducted on geographies consisting of 61,256,348 people shows a near-perfect positive correlation between the proportion of Immigrants from Micronesia and unemployment rate among population between the ages 20 and 24 in the United States with a correlation coefficient (R) of 0.919 and weighted average of 10.0%. Similarly, the statistical analysis conducted on geographies consisting of 515,498,484 people shows a moderate positive correlation between the proportion of Poles and unemployment rate among population between the ages 20 and 24 in the United States with a correlation coefficient (R) of 0.451 and weighted average of 10.0%, a difference of 0.16%.
Unemployment Among Ages 20 to 24 years Correlation Summary
| Measurement | Immigrants from Micronesia | Polish |
| Minimum | 0.70% | 2.3% |
| Maximum | 100.0% | 41.7% |
| Range | 99.3% | 39.4% |
| Mean | 17.9% | 11.9% |
| Median | 10.1% | 10.1% |
| Interquartile 25% (IQ1) | 8.6% | 9.3% |
| Interquartile 75% (IQ3) | 21.2% | 11.7% |
| Interquartile Range (IQR) | 12.6% | 2.5% |
| Standard Deviation (Sample) | 18.9% | 7.3% |
| Standard Deviation (Population) | 18.6% | 7.3% |
Demographics Similar to Immigrants from Micronesia and Poles by Unemployment Among Ages 20 to 24 years
In terms of unemployment among ages 20 to 24 years, the demographic groups most similar to Immigrants from Micronesia are Immigrants from Malaysia (10.0%, a difference of 0.090%), Bangladeshi (10.0%, a difference of 0.10%), Scotch-Irish (10.0%, a difference of 0.10%), Thai (10.0%, a difference of 0.10%), and Bhutanese (10.0%, a difference of 0.11%). Similarly, the demographic groups most similar to Poles are Macedonian (10.0%, a difference of 0.020%), Chilean (10.0%, a difference of 0.020%), Bhutanese (10.0%, a difference of 0.050%), Bangladeshi (10.0%, a difference of 0.060%), and Immigrants from Malaysia (10.0%, a difference of 0.070%).
| Demographics | Rating | Rank | Unemployment Among Ages 20 to 24 years |
| Yaqui | 98.0 /100 | #81 | Exceptional 9.9% |
| Sri Lankans | 98.0 /100 | #82 | Exceptional 9.9% |
| Immigrants | Bulgaria | 98.0 /100 | #83 | Exceptional 9.9% |
| Latvians | 97.9 /100 | #84 | Exceptional 9.9% |
| New Zealanders | 97.8 /100 | #85 | Exceptional 9.9% |
| Immigrants | Vietnam | 97.5 /100 | #86 | Exceptional 10.0% |
| Immigrants | Oceania | 97.4 /100 | #87 | Exceptional 10.0% |
| Poles | 97.1 /100 | #88 | Exceptional 10.0% |
| Macedonians | 97.0 /100 | #89 | Exceptional 10.0% |
| Chileans | 97.0 /100 | #90 | Exceptional 10.0% |
| Bhutanese | 96.9 /100 | #91 | Exceptional 10.0% |
| Bangladeshis | 96.9 /100 | #92 | Exceptional 10.0% |
| Immigrants | Malaysia | 96.9 /100 | #93 | Exceptional 10.0% |
| Immigrants | Micronesia | 96.6 /100 | #94 | Exceptional 10.0% |
| Scotch-Irish | 96.2 /100 | #95 | Exceptional 10.0% |
| Thais | 96.2 /100 | #96 | Exceptional 10.0% |
| Slavs | 96.1 /100 | #97 | Exceptional 10.0% |
| Japanese | 95.4 /100 | #98 | Exceptional 10.0% |
| Fijians | 95.3 /100 | #99 | Exceptional 10.0% |
| Immigrants | France | 95.2 /100 | #100 | Exceptional 10.0% |
| Laotians | 95.1 /100 | #101 | Exceptional 10.0% |