Immigrants from Western Africa vs Polish Disability
COMPARE
Immigrants from Western Africa
Polish
Disability
Disability Comparison
Immigrants from Western Africa
Poles
11.7%
DISABILITY
47.5/ 100
METRIC RATING
176th/ 347
METRIC RANK
12.2%
DISABILITY
1.7/ 100
METRIC RATING
242nd/ 347
METRIC RANK
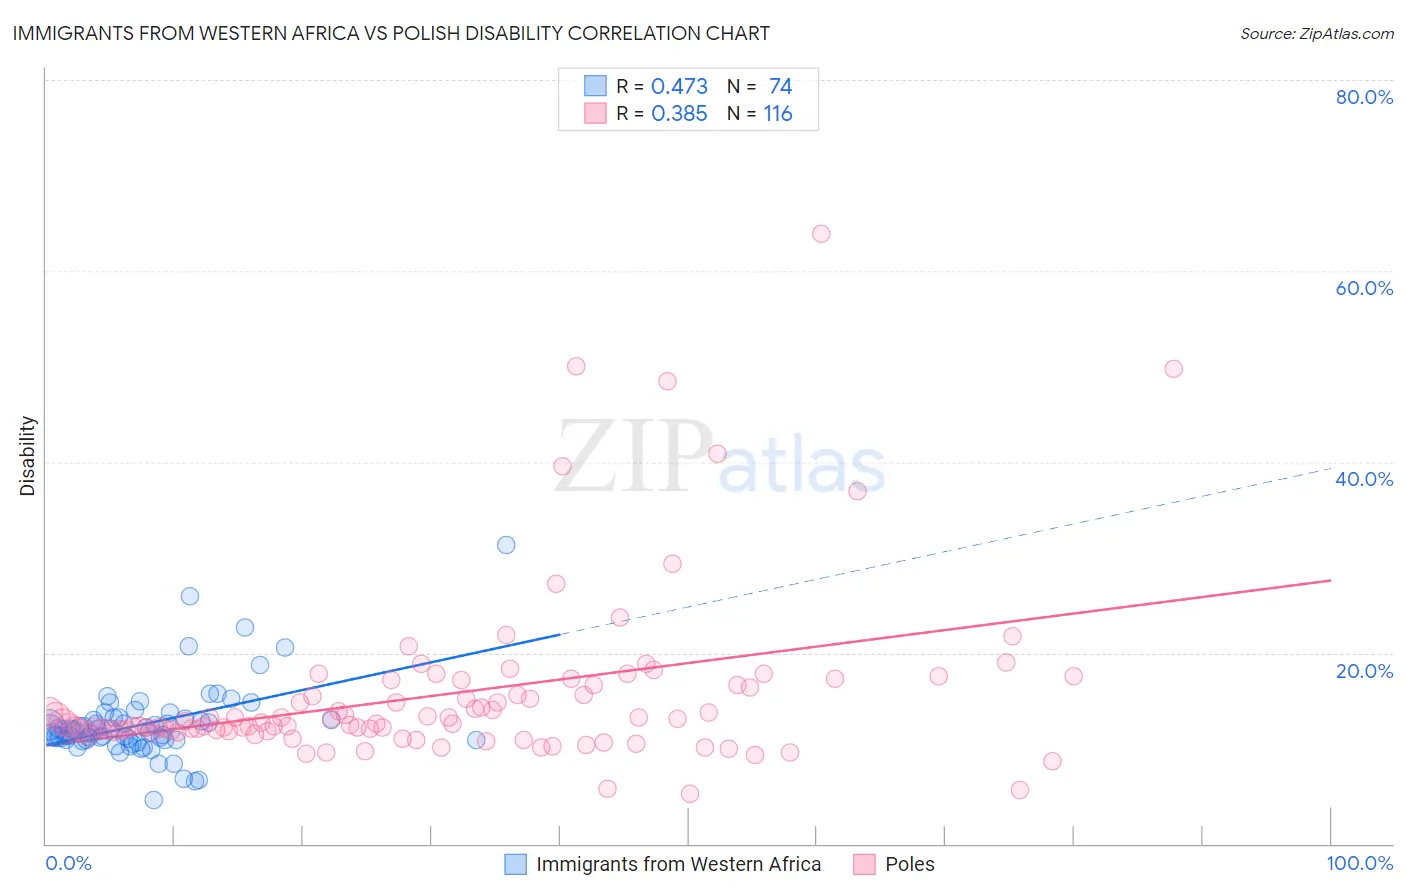
Immigrants from Western Africa vs Polish Disability Correlation Chart
The statistical analysis conducted on geographies consisting of 357,817,429 people shows a moderate positive correlation between the proportion of Immigrants from Western Africa and percentage of population with a disability in the United States with a correlation coefficient (R) of 0.473 and weighted average of 11.7%. Similarly, the statistical analysis conducted on geographies consisting of 560,456,636 people shows a mild positive correlation between the proportion of Poles and percentage of population with a disability in the United States with a correlation coefficient (R) of 0.385 and weighted average of 12.2%, a difference of 4.4%.
Disability Correlation Summary
| Measurement | Immigrants from Western Africa | Polish |
| Minimum | 4.6% | 5.3% |
| Maximum | 31.3% | 63.9% |
| Range | 26.7% | 58.6% |
| Mean | 12.6% | 15.6% |
| Median | 11.9% | 12.7% |
| Interquartile 25% (IQ1) | 10.9% | 11.8% |
| Interquartile 75% (IQ3) | 13.0% | 16.6% |
| Interquartile Range (IQR) | 2.2% | 4.8% |
| Standard Deviation (Sample) | 4.0% | 9.1% |
| Standard Deviation (Population) | 4.0% | 9.0% |
Similar Demographics by Disability
Demographics Similar to Immigrants from Western Africa by Disability
In terms of disability, the demographic groups most similar to Immigrants from Western Africa are Immigrants from Central America (11.7%, a difference of 0.040%), Haitian (11.7%, a difference of 0.050%), Greek (11.7%, a difference of 0.060%), Albanian (11.7%, a difference of 0.11%), and Maltese (11.7%, a difference of 0.14%).
| Demographics | Rating | Rank | Disability |
| Immigrants | Austria | 53.4 /100 | #169 | Average 11.7% |
| Immigrants | Albania | 52.8 /100 | #170 | Average 11.7% |
| Immigrants | Southern Europe | 52.8 /100 | #171 | Average 11.7% |
| Trinidadians and Tobagonians | 52.7 /100 | #172 | Average 11.7% |
| Maltese | 50.6 /100 | #173 | Average 11.7% |
| Albanians | 50.0 /100 | #174 | Average 11.7% |
| Haitians | 48.6 /100 | #175 | Average 11.7% |
| Immigrants | Western Africa | 47.5 /100 | #176 | Average 11.7% |
| Immigrants | Central America | 46.6 /100 | #177 | Average 11.7% |
| Greeks | 46.2 /100 | #178 | Average 11.7% |
| Immigrants | Armenia | 41.9 /100 | #179 | Average 11.7% |
| Immigrants | Honduras | 37.8 /100 | #180 | Fair 11.8% |
| Immigrants | Oceania | 34.3 /100 | #181 | Fair 11.8% |
| Icelanders | 34.0 /100 | #182 | Fair 11.8% |
| Hondurans | 31.2 /100 | #183 | Fair 11.8% |
Demographics Similar to Poles by Disability
In terms of disability, the demographic groups most similar to Poles are Hungarian (12.2%, a difference of 0.020%), Yugoslavian (12.2%, a difference of 0.020%), Swedish (12.2%, a difference of 0.080%), British (12.2%, a difference of 0.090%), and Basque (12.2%, a difference of 0.090%).
| Demographics | Rating | Rank | Disability |
| Yup'ik | 2.2 /100 | #235 | Tragic 12.2% |
| Chinese | 2.0 /100 | #236 | Tragic 12.2% |
| Immigrants | Congo | 1.9 /100 | #237 | Tragic 12.2% |
| Norwegians | 1.9 /100 | #238 | Tragic 12.2% |
| Swedes | 1.8 /100 | #239 | Tragic 12.2% |
| Hungarians | 1.7 /100 | #240 | Tragic 12.2% |
| Yugoslavians | 1.7 /100 | #241 | Tragic 12.2% |
| Poles | 1.7 /100 | #242 | Tragic 12.2% |
| British | 1.5 /100 | #243 | Tragic 12.2% |
| Basques | 1.5 /100 | #244 | Tragic 12.2% |
| Liberians | 1.5 /100 | #245 | Tragic 12.2% |
| Swiss | 1.5 /100 | #246 | Tragic 12.2% |
| Indonesians | 1.4 /100 | #247 | Tragic 12.2% |
| Guamanians/Chamorros | 1.4 /100 | #248 | Tragic 12.3% |
| Carpatho Rusyns | 1.4 /100 | #249 | Tragic 12.3% |