Immigrants from Pakistan vs Immigrants from Albania Self-Care Disability
COMPARE
Immigrants from Pakistan
Immigrants from Albania
Self-Care Disability
Self-Care Disability Comparison
Immigrants from Pakistan
Immigrants from Albania
2.3%
SELF-CARE DISABILITY
99.8/ 100
METRIC RATING
43rd/ 347
METRIC RANK
2.6%
SELF-CARE DISABILITY
0.6/ 100
METRIC RATING
247th/ 347
METRIC RANK
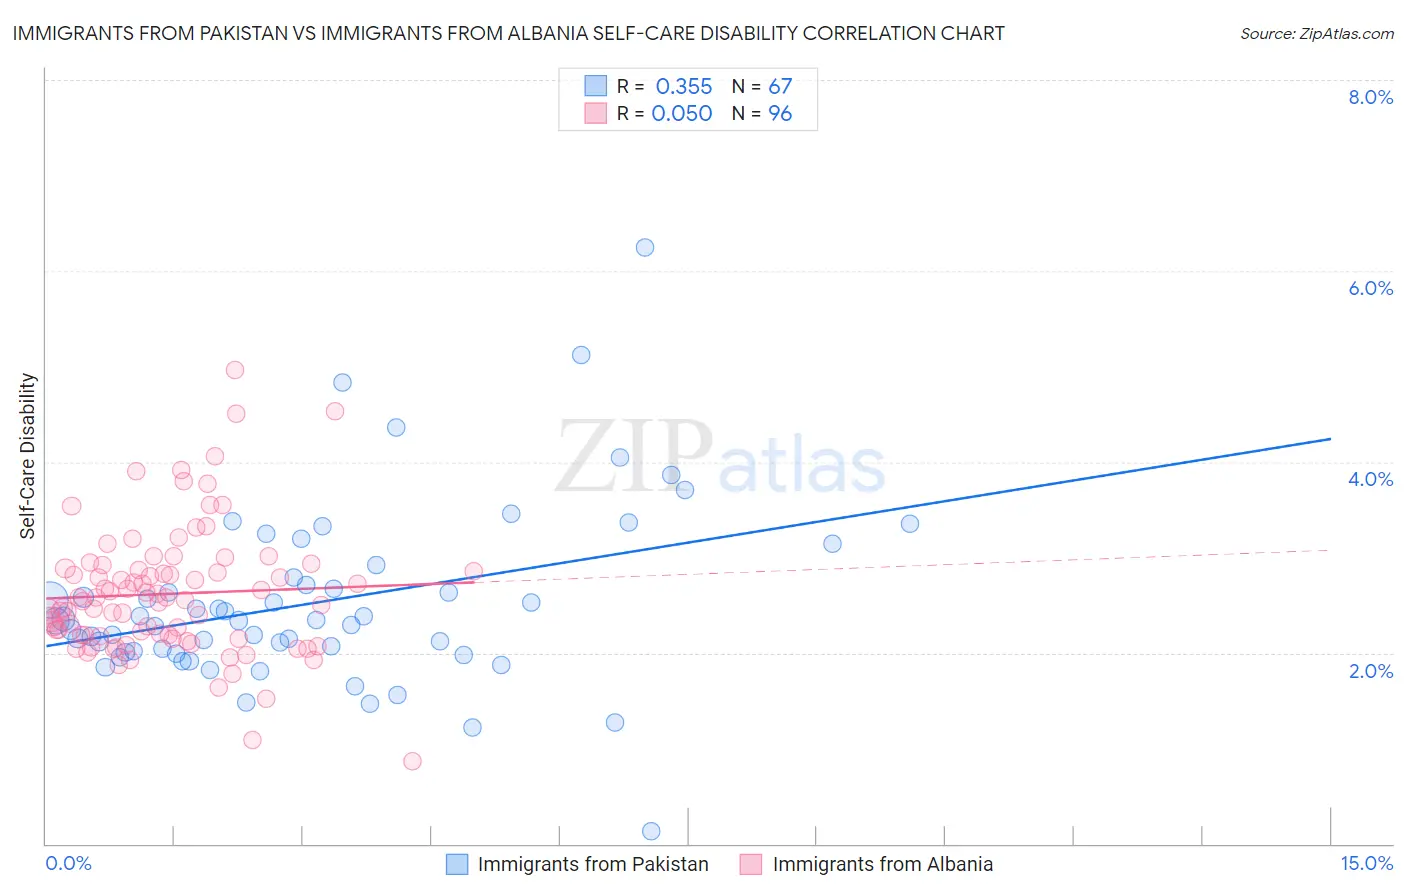
Immigrants from Pakistan vs Immigrants from Albania Self-Care Disability Correlation Chart
The statistical analysis conducted on geographies consisting of 283,675,484 people shows a mild positive correlation between the proportion of Immigrants from Pakistan and percentage of population with self-care disability in the United States with a correlation coefficient (R) of 0.355 and weighted average of 2.3%. Similarly, the statistical analysis conducted on geographies consisting of 119,364,841 people shows a slight positive correlation between the proportion of Immigrants from Albania and percentage of population with self-care disability in the United States with a correlation coefficient (R) of 0.050 and weighted average of 2.6%, a difference of 14.7%.
Self-Care Disability Correlation Summary
| Measurement | Immigrants from Pakistan | Immigrants from Albania |
| Minimum | 0.14% | 0.86% |
| Maximum | 6.2% | 5.0% |
| Range | 6.1% | 4.1% |
| Mean | 2.5% | 2.6% |
| Median | 2.3% | 2.5% |
| Interquartile 25% (IQ1) | 2.0% | 2.2% |
| Interquartile 75% (IQ3) | 2.8% | 2.9% |
| Interquartile Range (IQR) | 0.78% | 0.70% |
| Standard Deviation (Sample) | 0.95% | 0.68% |
| Standard Deviation (Population) | 0.94% | 0.67% |
Similar Demographics by Self-Care Disability
Demographics Similar to Immigrants from Pakistan by Self-Care Disability
In terms of self-care disability, the demographic groups most similar to Immigrants from Pakistan are Immigrants from South Africa (2.3%, a difference of 0.040%), Immigrants from Uganda (2.3%, a difference of 0.050%), Norwegian (2.3%, a difference of 0.090%), Immigrants from Sudan (2.3%, a difference of 0.14%), and Czech (2.3%, a difference of 0.17%).
| Demographics | Rating | Rank | Self-Care Disability |
| Immigrants | Lithuania | 99.9 /100 | #36 | Exceptional 2.3% |
| Immigrants | Sweden | 99.9 /100 | #37 | Exceptional 2.3% |
| Immigrants | Eastern Africa | 99.9 /100 | #38 | Exceptional 2.3% |
| Immigrants | Bulgaria | 99.8 /100 | #39 | Exceptional 2.3% |
| Iranians | 99.8 /100 | #40 | Exceptional 2.3% |
| Immigrants | Sudan | 99.8 /100 | #41 | Exceptional 2.3% |
| Immigrants | Uganda | 99.8 /100 | #42 | Exceptional 2.3% |
| Immigrants | Pakistan | 99.8 /100 | #43 | Exceptional 2.3% |
| Immigrants | South Africa | 99.8 /100 | #44 | Exceptional 2.3% |
| Norwegians | 99.8 /100 | #45 | Exceptional 2.3% |
| Czechs | 99.8 /100 | #46 | Exceptional 2.3% |
| Jordanians | 99.7 /100 | #47 | Exceptional 2.3% |
| Immigrants | Malaysia | 99.7 /100 | #48 | Exceptional 2.3% |
| Latvians | 99.7 /100 | #49 | Exceptional 2.3% |
| Immigrants | Brazil | 99.7 /100 | #50 | Exceptional 2.3% |
Demographics Similar to Immigrants from Albania by Self-Care Disability
In terms of self-care disability, the demographic groups most similar to Immigrants from Albania are Nicaraguan (2.6%, a difference of 0.0%), Cheyenne (2.6%, a difference of 0.13%), Immigrants from Western Asia (2.6%, a difference of 0.15%), Mexican American Indian (2.6%, a difference of 0.24%), and Portuguese (2.6%, a difference of 0.32%).
| Demographics | Rating | Rank | Self-Care Disability |
| Marshallese | 1.2 /100 | #240 | Tragic 2.6% |
| Immigrants | Syria | 1.0 /100 | #241 | Tragic 2.6% |
| Spanish | 0.8 /100 | #242 | Tragic 2.6% |
| Hawaiians | 0.8 /100 | #243 | Tragic 2.6% |
| Yuman | 0.8 /100 | #244 | Tragic 2.6% |
| Immigrants | Western Asia | 0.6 /100 | #245 | Tragic 2.6% |
| Cheyenne | 0.6 /100 | #246 | Tragic 2.6% |
| Immigrants | Albania | 0.6 /100 | #247 | Tragic 2.6% |
| Nicaraguans | 0.6 /100 | #248 | Tragic 2.6% |
| Mexican American Indians | 0.5 /100 | #249 | Tragic 2.6% |
| Portuguese | 0.4 /100 | #250 | Tragic 2.6% |
| Immigrants | Liberia | 0.4 /100 | #251 | Tragic 2.6% |
| Immigrants | Bangladesh | 0.4 /100 | #252 | Tragic 2.6% |
| Immigrants | Haiti | 0.3 /100 | #253 | Tragic 2.6% |
| Haitians | 0.3 /100 | #254 | Tragic 2.6% |