Immigrants from Micronesia vs Immigrants from Albania 7th Grade
COMPARE
Immigrants from Micronesia
Immigrants from Albania
7th Grade
7th Grade Comparison
Immigrants from Micronesia
Immigrants from Albania
95.9%
7TH GRADE
32.6/ 100
METRIC RATING
190th/ 347
METRIC RANK
96.0%
7TH GRADE
50.4/ 100
METRIC RATING
173rd/ 347
METRIC RANK
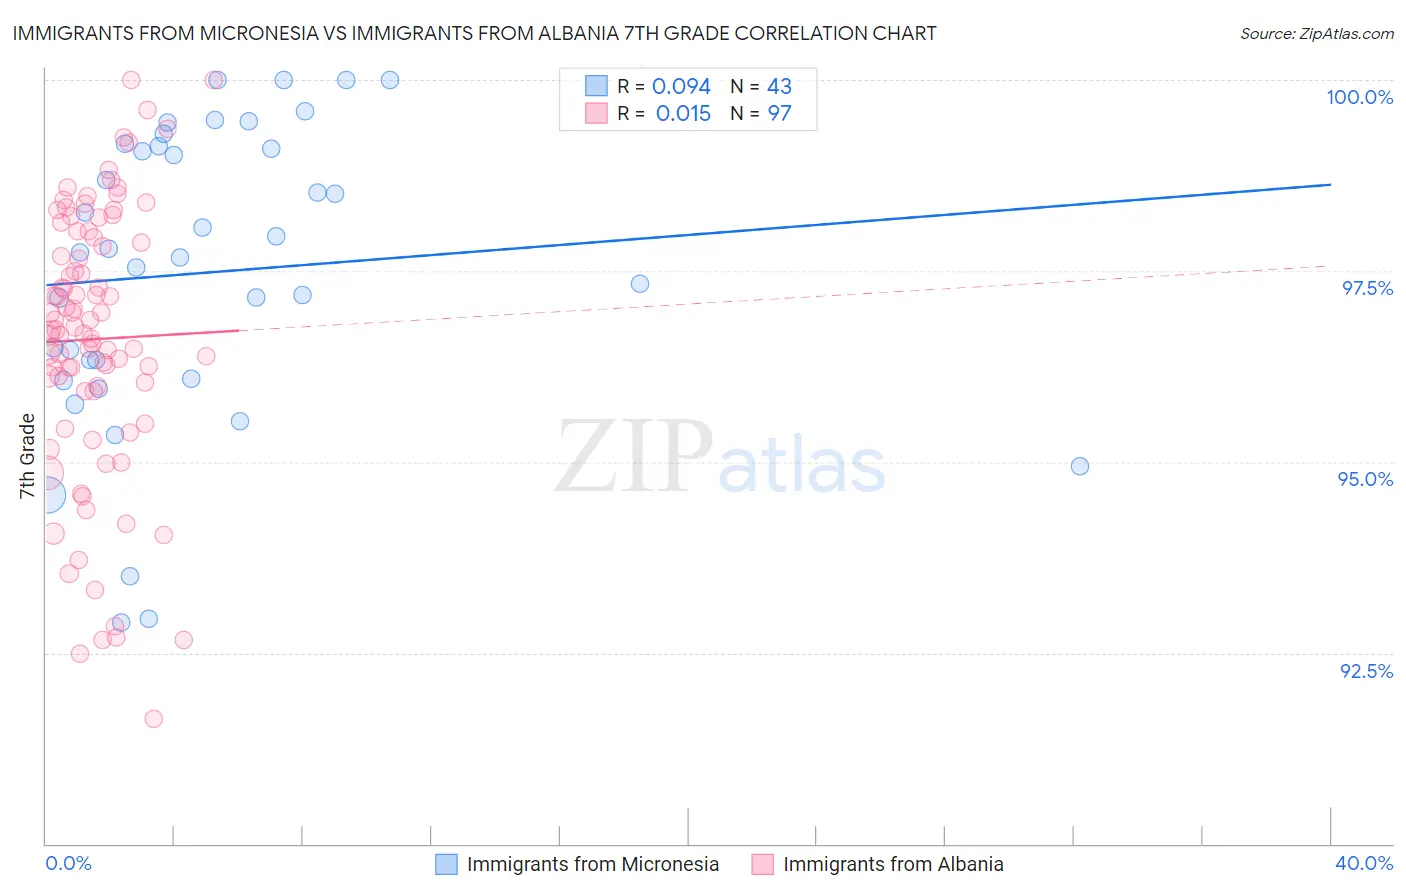
Immigrants from Micronesia vs Immigrants from Albania 7th Grade Correlation Chart
The statistical analysis conducted on geographies consisting of 61,604,657 people shows a slight positive correlation between the proportion of Immigrants from Micronesia and percentage of population with at least 7th grade education in the United States with a correlation coefficient (R) of 0.094 and weighted average of 95.9%. Similarly, the statistical analysis conducted on geographies consisting of 119,265,453 people shows no correlation between the proportion of Immigrants from Albania and percentage of population with at least 7th grade education in the United States with a correlation coefficient (R) of 0.015 and weighted average of 96.0%, a difference of 0.11%.
7th Grade Correlation Summary
| Measurement | Immigrants from Micronesia | Immigrants from Albania |
| Minimum | 92.9% | 91.6% |
| Maximum | 100.0% | 100.0% |
| Range | 7.1% | 8.4% |
| Mean | 97.5% | 96.6% |
| Median | 97.7% | 96.7% |
| Interquartile 25% (IQ1) | 96.1% | 95.9% |
| Interquartile 75% (IQ3) | 99.1% | 98.0% |
| Interquartile Range (IQR) | 3.1% | 2.0% |
| Standard Deviation (Sample) | 1.9% | 1.8% |
| Standard Deviation (Population) | 1.9% | 1.8% |
Demographics Similar to Immigrants from Micronesia and Immigrants from Albania by 7th Grade
In terms of 7th grade, the demographic groups most similar to Immigrants from Micronesia are Liberian (95.9%, a difference of 0.0%), Immigrants from Egypt (95.9%, a difference of 0.010%), Immigrants from Venezuela (95.9%, a difference of 0.010%), Immigrants from Iraq (96.0%, a difference of 0.020%), and Immigrants from Uganda (96.0%, a difference of 0.020%). Similarly, the demographic groups most similar to Immigrants from Albania are Mongolian (96.0%, a difference of 0.0%), Venezuelan (96.0%, a difference of 0.010%), Black/African American (96.0%, a difference of 0.010%), Chilean (96.0%, a difference of 0.010%), and Immigrants from Korea (96.0%, a difference of 0.010%).
| Demographics | Rating | Rank | 7th Grade |
| Egyptians | 54.2 /100 | #171 | Average 96.1% |
| Venezuelans | 51.4 /100 | #172 | Average 96.0% |
| Immigrants | Albania | 50.4 /100 | #173 | Average 96.0% |
| Mongolians | 50.0 /100 | #174 | Average 96.0% |
| Blacks/African Americans | 49.5 /100 | #175 | Average 96.0% |
| Chileans | 49.3 /100 | #176 | Average 96.0% |
| Immigrants | Korea | 49.2 /100 | #177 | Average 96.0% |
| Marshallese | 48.4 /100 | #178 | Average 96.0% |
| Immigrants | Iran | 47.8 /100 | #179 | Average 96.0% |
| Immigrants | Brazil | 46.8 /100 | #180 | Average 96.0% |
| Pakistanis | 44.5 /100 | #181 | Average 96.0% |
| Iraqis | 41.2 /100 | #182 | Average 96.0% |
| Immigrants | Spain | 38.8 /100 | #183 | Fair 96.0% |
| Sierra Leoneans | 37.5 /100 | #184 | Fair 96.0% |
| Brazilians | 37.3 /100 | #185 | Fair 96.0% |
| Immigrants | Iraq | 36.1 /100 | #186 | Fair 96.0% |
| Immigrants | Uganda | 36.0 /100 | #187 | Fair 96.0% |
| Immigrants | Egypt | 34.3 /100 | #188 | Fair 95.9% |
| Immigrants | Venezuela | 33.9 /100 | #189 | Fair 95.9% |
| Immigrants | Micronesia | 32.6 /100 | #190 | Fair 95.9% |
| Liberians | 32.5 /100 | #191 | Fair 95.9% |