Immigrants from Uzbekistan vs Immigrants from Albania Self-Care Disability
COMPARE
Immigrants from Uzbekistan
Immigrants from Albania
Self-Care Disability
Self-Care Disability Comparison
Immigrants from Uzbekistan
Immigrants from Albania
2.9%
SELF-CARE DISABILITY
0.0/ 100
METRIC RATING
325th/ 347
METRIC RANK
2.6%
SELF-CARE DISABILITY
0.6/ 100
METRIC RATING
247th/ 347
METRIC RANK
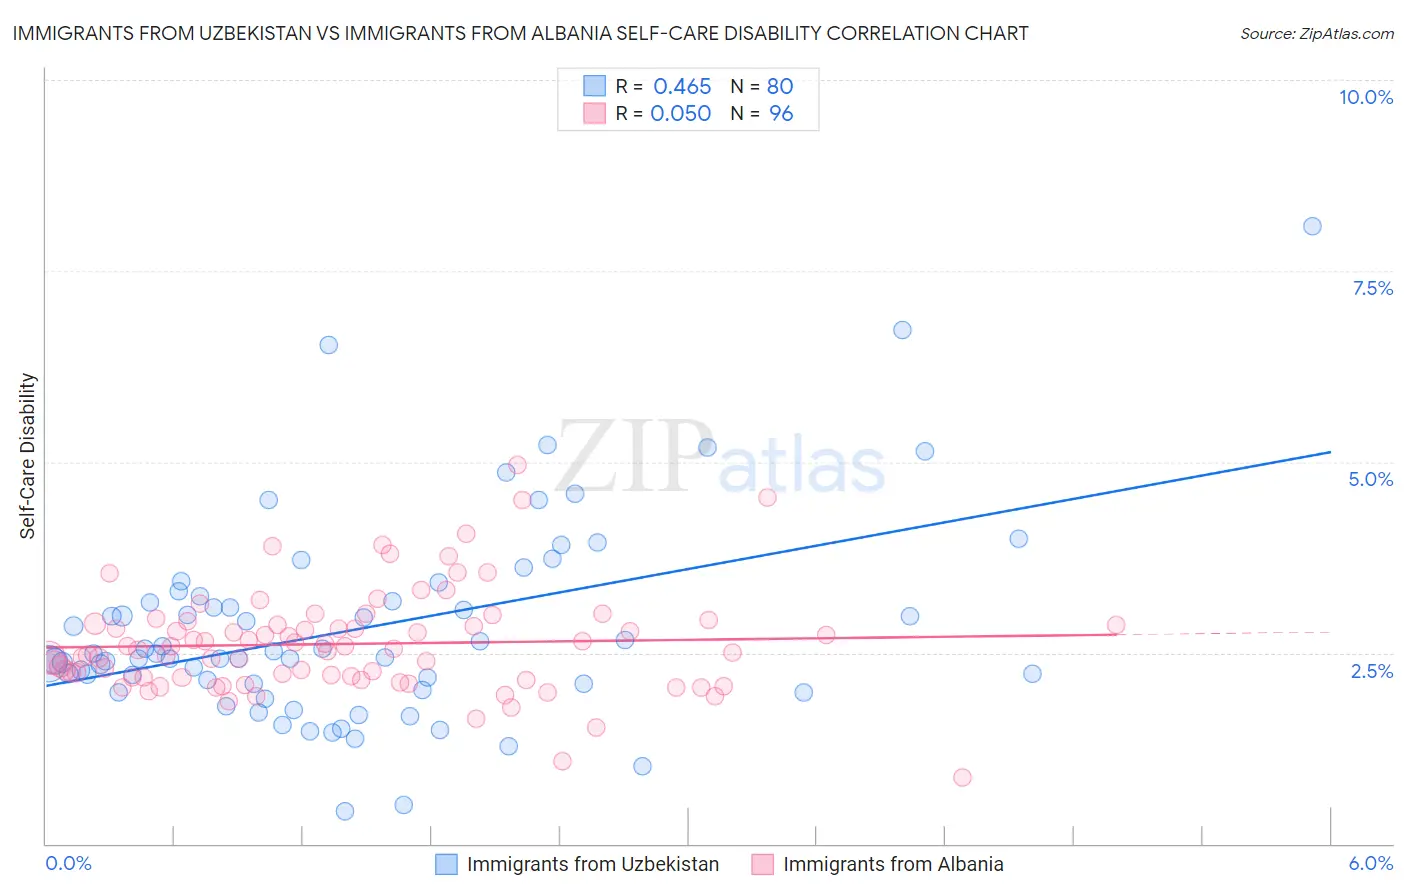
Immigrants from Uzbekistan vs Immigrants from Albania Self-Care Disability Correlation Chart
The statistical analysis conducted on geographies consisting of 118,703,600 people shows a moderate positive correlation between the proportion of Immigrants from Uzbekistan and percentage of population with self-care disability in the United States with a correlation coefficient (R) of 0.465 and weighted average of 2.9%. Similarly, the statistical analysis conducted on geographies consisting of 119,364,841 people shows a slight positive correlation between the proportion of Immigrants from Albania and percentage of population with self-care disability in the United States with a correlation coefficient (R) of 0.050 and weighted average of 2.6%, a difference of 10.5%.
Self-Care Disability Correlation Summary
| Measurement | Immigrants from Uzbekistan | Immigrants from Albania |
| Minimum | 0.43% | 0.86% |
| Maximum | 8.1% | 5.0% |
| Range | 7.6% | 4.1% |
| Mean | 2.8% | 2.6% |
| Median | 2.5% | 2.5% |
| Interquartile 25% (IQ1) | 2.1% | 2.2% |
| Interquartile 75% (IQ3) | 3.2% | 2.9% |
| Interquartile Range (IQR) | 1.1% | 0.70% |
| Standard Deviation (Sample) | 1.3% | 0.68% |
| Standard Deviation (Population) | 1.3% | 0.67% |
Similar Demographics by Self-Care Disability
Demographics Similar to Immigrants from Uzbekistan by Self-Care Disability
In terms of self-care disability, the demographic groups most similar to Immigrants from Uzbekistan are Cherokee (2.9%, a difference of 0.53%), Seminole (2.9%, a difference of 0.63%), Comanche (2.9%, a difference of 0.75%), Paiute (2.9%, a difference of 0.94%), and Black/African American (2.9%, a difference of 1.0%).
| Demographics | Rating | Rank | Self-Care Disability |
| Assyrians/Chaldeans/Syriacs | 0.0 /100 | #318 | Tragic 2.8% |
| Spanish American Indians | 0.0 /100 | #319 | Tragic 2.9% |
| Chickasaw | 0.0 /100 | #320 | Tragic 2.9% |
| Navajo | 0.0 /100 | #321 | Tragic 2.9% |
| Comanche | 0.0 /100 | #322 | Tragic 2.9% |
| Seminole | 0.0 /100 | #323 | Tragic 2.9% |
| Cherokee | 0.0 /100 | #324 | Tragic 2.9% |
| Immigrants | Uzbekistan | 0.0 /100 | #325 | Tragic 2.9% |
| Paiute | 0.0 /100 | #326 | Tragic 2.9% |
| Blacks/African Americans | 0.0 /100 | #327 | Tragic 2.9% |
| Hopi | 0.0 /100 | #328 | Tragic 2.9% |
| Cajuns | 0.0 /100 | #329 | Tragic 2.9% |
| Nepalese | 0.0 /100 | #330 | Tragic 3.0% |
| Lumbee | 0.0 /100 | #331 | Tragic 3.0% |
| Kiowa | 0.0 /100 | #332 | Tragic 3.0% |
Demographics Similar to Immigrants from Albania by Self-Care Disability
In terms of self-care disability, the demographic groups most similar to Immigrants from Albania are Nicaraguan (2.6%, a difference of 0.0%), Cheyenne (2.6%, a difference of 0.13%), Immigrants from Western Asia (2.6%, a difference of 0.15%), Mexican American Indian (2.6%, a difference of 0.24%), and Portuguese (2.6%, a difference of 0.32%).
| Demographics | Rating | Rank | Self-Care Disability |
| Marshallese | 1.2 /100 | #240 | Tragic 2.6% |
| Immigrants | Syria | 1.0 /100 | #241 | Tragic 2.6% |
| Spanish | 0.8 /100 | #242 | Tragic 2.6% |
| Hawaiians | 0.8 /100 | #243 | Tragic 2.6% |
| Yuman | 0.8 /100 | #244 | Tragic 2.6% |
| Immigrants | Western Asia | 0.6 /100 | #245 | Tragic 2.6% |
| Cheyenne | 0.6 /100 | #246 | Tragic 2.6% |
| Immigrants | Albania | 0.6 /100 | #247 | Tragic 2.6% |
| Nicaraguans | 0.6 /100 | #248 | Tragic 2.6% |
| Mexican American Indians | 0.5 /100 | #249 | Tragic 2.6% |
| Portuguese | 0.4 /100 | #250 | Tragic 2.6% |
| Immigrants | Liberia | 0.4 /100 | #251 | Tragic 2.6% |
| Immigrants | Bangladesh | 0.4 /100 | #252 | Tragic 2.6% |
| Immigrants | Haiti | 0.3 /100 | #253 | Tragic 2.6% |
| Haitians | 0.3 /100 | #254 | Tragic 2.6% |