Immigrants from Micronesia vs Honduran Male Disability
COMPARE
Immigrants from Micronesia
Honduran
Male Disability
Male Disability Comparison
Immigrants from Micronesia
Hondurans
12.9%
MALE DISABILITY
0.0/ 100
METRIC RATING
295th/ 347
METRIC RANK
11.3%
MALE DISABILITY
41.1/ 100
METRIC RATING
180th/ 347
METRIC RANK
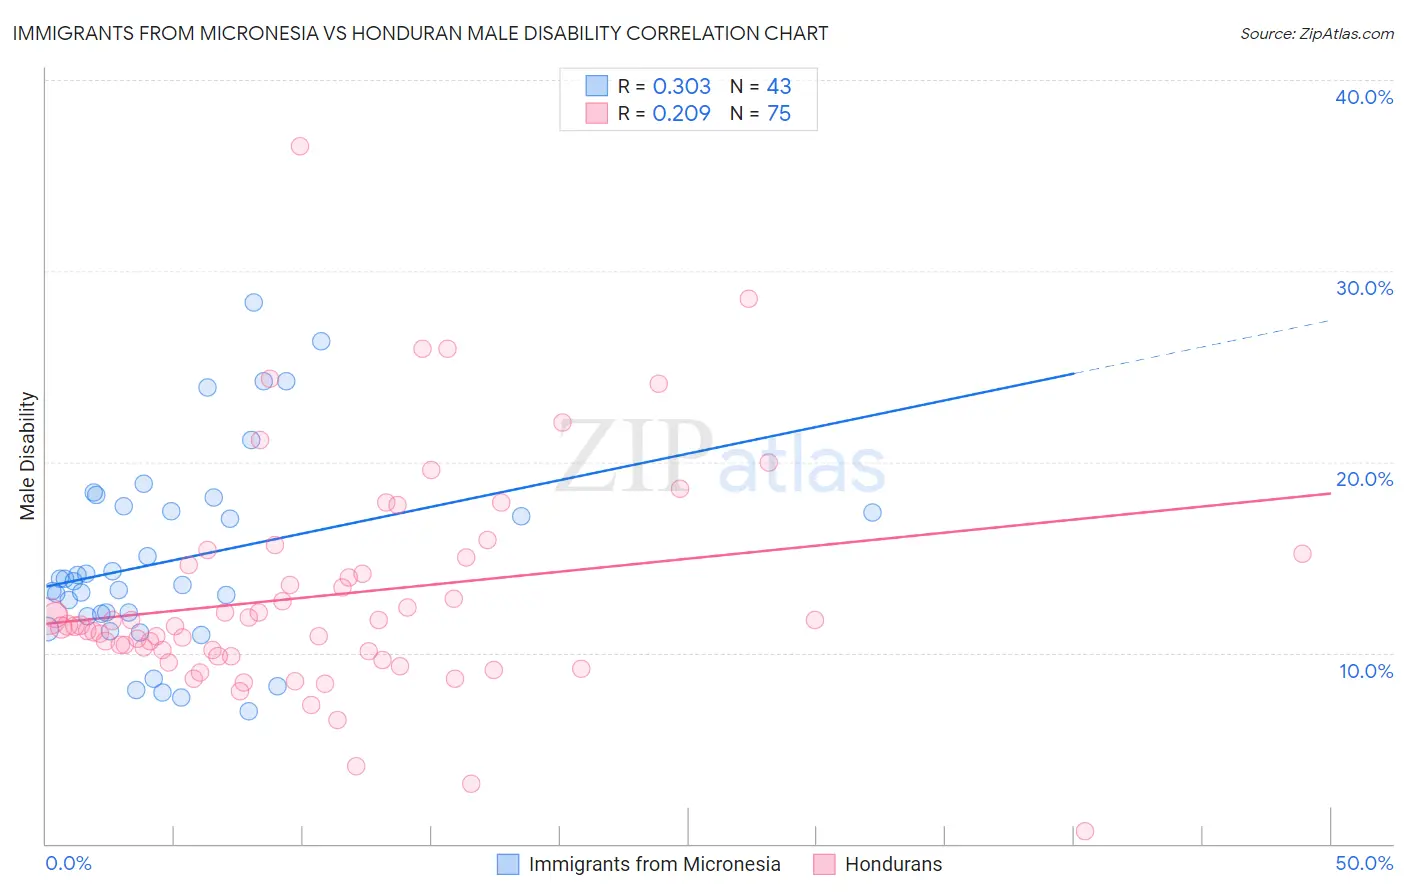
Immigrants from Micronesia vs Honduran Male Disability Correlation Chart
The statistical analysis conducted on geographies consisting of 61,603,826 people shows a mild positive correlation between the proportion of Immigrants from Micronesia and percentage of males with a disability in the United States with a correlation coefficient (R) of 0.303 and weighted average of 12.9%. Similarly, the statistical analysis conducted on geographies consisting of 357,765,878 people shows a weak positive correlation between the proportion of Hondurans and percentage of males with a disability in the United States with a correlation coefficient (R) of 0.209 and weighted average of 11.3%, a difference of 14.7%.
Male Disability Correlation Summary
| Measurement | Immigrants from Micronesia | Honduran |
| Minimum | 6.9% | 0.65% |
| Maximum | 28.3% | 36.5% |
| Range | 21.4% | 35.9% |
| Mean | 14.9% | 13.0% |
| Median | 13.8% | 11.4% |
| Interquartile 25% (IQ1) | 11.9% | 9.8% |
| Interquartile 75% (IQ3) | 17.6% | 15.0% |
| Interquartile Range (IQR) | 5.7% | 5.1% |
| Standard Deviation (Sample) | 5.1% | 5.8% |
| Standard Deviation (Population) | 5.0% | 5.8% |
Similar Demographics by Male Disability
Demographics Similar to Immigrants from Micronesia by Male Disability
In terms of male disability, the demographic groups most similar to Immigrants from Micronesia are Nonimmigrants (12.9%, a difference of 0.070%), Marshallese (12.9%, a difference of 0.10%), Inupiat (13.0%, a difference of 0.17%), Yaqui (12.9%, a difference of 0.33%), and Pennsylvania German (13.0%, a difference of 0.37%).
| Demographics | Rating | Rank | Male Disability |
| Yup'ik | 0.0 /100 | #288 | Tragic 12.8% |
| Immigrants | Cabo Verde | 0.0 /100 | #289 | Tragic 12.8% |
| Pima | 0.0 /100 | #290 | Tragic 12.8% |
| Whites/Caucasians | 0.0 /100 | #291 | Tragic 12.8% |
| English | 0.0 /100 | #292 | Tragic 12.8% |
| Yaqui | 0.0 /100 | #293 | Tragic 12.9% |
| Marshallese | 0.0 /100 | #294 | Tragic 12.9% |
| Immigrants | Micronesia | 0.0 /100 | #295 | Tragic 12.9% |
| Immigrants | Nonimmigrants | 0.0 /100 | #296 | Tragic 12.9% |
| Inupiat | 0.0 /100 | #297 | Tragic 13.0% |
| Pennsylvania Germans | 0.0 /100 | #298 | Tragic 13.0% |
| Celtics | 0.0 /100 | #299 | Tragic 13.0% |
| Cheyenne | 0.0 /100 | #300 | Tragic 13.0% |
| French | 0.0 /100 | #301 | Tragic 13.0% |
| Crow | 0.0 /100 | #302 | Tragic 13.1% |
Demographics Similar to Hondurans by Male Disability
In terms of male disability, the demographic groups most similar to Hondurans are Immigrants from Caribbean (11.3%, a difference of 0.020%), Australian (11.3%, a difference of 0.060%), Immigrants from Norway (11.3%, a difference of 0.17%), Syrian (11.2%, a difference of 0.31%), and Immigrants from Senegal (11.3%, a difference of 0.40%).
| Demographics | Rating | Rank | Male Disability |
| Immigrants | Burma/Myanmar | 50.4 /100 | #173 | Average 11.2% |
| Maltese | 50.0 /100 | #174 | Average 11.2% |
| Immigrants | Honduras | 48.7 /100 | #175 | Average 11.2% |
| Syrians | 46.6 /100 | #176 | Average 11.2% |
| Immigrants | Norway | 44.2 /100 | #177 | Average 11.3% |
| Australians | 42.2 /100 | #178 | Average 11.3% |
| Immigrants | Caribbean | 41.4 /100 | #179 | Average 11.3% |
| Hondurans | 41.1 /100 | #180 | Average 11.3% |
| Immigrants | Senegal | 34.4 /100 | #181 | Fair 11.3% |
| Immigrants | Belize | 33.7 /100 | #182 | Fair 11.3% |
| Immigrants | Central America | 32.9 /100 | #183 | Fair 11.3% |
| Iraqis | 30.5 /100 | #184 | Fair 11.3% |
| Pakistanis | 30.3 /100 | #185 | Fair 11.3% |
| Immigrants | Zaire | 27.6 /100 | #186 | Fair 11.4% |
| Immigrants | Austria | 27.3 /100 | #187 | Fair 11.4% |