Immigrants from Micronesia vs Honduran 1st Grade
COMPARE
Immigrants from Micronesia
Honduran
1st Grade
1st Grade Comparison
Immigrants from Micronesia
Hondurans
97.9%
1ST GRADE
55.3/ 100
METRIC RATING
169th/ 347
METRIC RANK
96.9%
1ST GRADE
0.0/ 100
METRIC RATING
314th/ 347
METRIC RANK
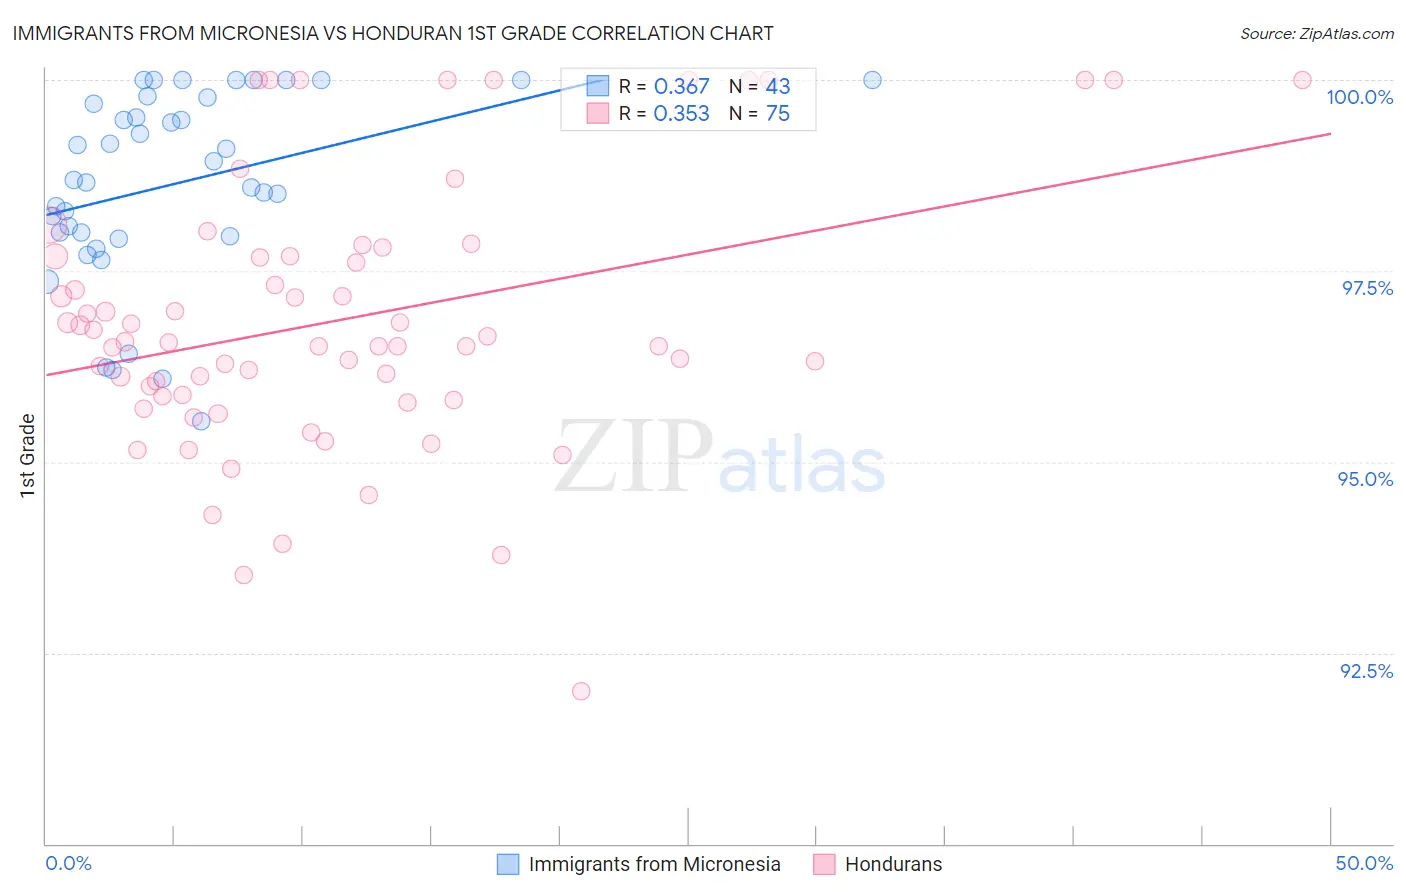
Immigrants from Micronesia vs Honduran 1st Grade Correlation Chart
The statistical analysis conducted on geographies consisting of 61,604,657 people shows a mild positive correlation between the proportion of Immigrants from Micronesia and percentage of population with at least 1st grade education in the United States with a correlation coefficient (R) of 0.367 and weighted average of 97.9%. Similarly, the statistical analysis conducted on geographies consisting of 357,783,041 people shows a mild positive correlation between the proportion of Hondurans and percentage of population with at least 1st grade education in the United States with a correlation coefficient (R) of 0.353 and weighted average of 96.9%, a difference of 1.1%.
1st Grade Correlation Summary
| Measurement | Immigrants from Micronesia | Honduran |
| Minimum | 95.5% | 92.0% |
| Maximum | 100.0% | 100.0% |
| Range | 4.5% | 8.0% |
| Mean | 98.6% | 96.9% |
| Median | 98.7% | 96.6% |
| Interquartile 25% (IQ1) | 98.0% | 95.9% |
| Interquartile 75% (IQ3) | 99.8% | 97.7% |
| Interquartile Range (IQR) | 1.8% | 1.8% |
| Standard Deviation (Sample) | 1.2% | 1.7% |
| Standard Deviation (Population) | 1.2% | 1.7% |
Similar Demographics by 1st Grade
Demographics Similar to Immigrants from Micronesia by 1st Grade
In terms of 1st grade, the demographic groups most similar to Immigrants from Micronesia are Ugandan (97.9%, a difference of 0.0%), Navajo (97.9%, a difference of 0.0%), Bermudan (97.9%, a difference of 0.0%), Chilean (97.9%, a difference of 0.0%), and Immigrants from Spain (97.9%, a difference of 0.0%).
| Demographics | Rating | Rank | 1st Grade |
| Immigrants | Eastern Europe | 58.9 /100 | #162 | Average 97.9% |
| Spanish Americans | 57.7 /100 | #163 | Average 97.9% |
| Brazilians | 57.6 /100 | #164 | Average 97.9% |
| Ugandans | 56.9 /100 | #165 | Average 97.9% |
| Navajo | 56.6 /100 | #166 | Average 97.9% |
| Bermudans | 56.3 /100 | #167 | Average 97.9% |
| Chileans | 55.6 /100 | #168 | Average 97.9% |
| Immigrants | Micronesia | 55.3 /100 | #169 | Average 97.9% |
| Immigrants | Spain | 54.9 /100 | #170 | Average 97.9% |
| Immigrants | Jordan | 53.9 /100 | #171 | Average 97.9% |
| Immigrants | Korea | 53.0 /100 | #172 | Average 97.9% |
| Kenyans | 51.2 /100 | #173 | Average 97.9% |
| Natives/Alaskans | 50.0 /100 | #174 | Average 97.9% |
| Immigrants | Sri Lanka | 49.7 /100 | #175 | Average 97.9% |
| Albanians | 49.6 /100 | #176 | Average 97.9% |
Demographics Similar to Hondurans by 1st Grade
In terms of 1st grade, the demographic groups most similar to Hondurans are Immigrants from Belize (96.9%, a difference of 0.010%), Cape Verdean (96.9%, a difference of 0.020%), Guyanese (96.9%, a difference of 0.020%), Immigrants from Ecuador (96.9%, a difference of 0.020%), and Immigrants from Nicaragua (96.9%, a difference of 0.020%).
| Demographics | Rating | Rank | 1st Grade |
| Immigrants | Somalia | 0.0 /100 | #307 | Tragic 96.9% |
| Hispanics or Latinos | 0.0 /100 | #308 | Tragic 96.9% |
| Immigrants | Haiti | 0.0 /100 | #309 | Tragic 96.9% |
| Immigrants | Azores | 0.0 /100 | #310 | Tragic 96.9% |
| Sri Lankans | 0.0 /100 | #311 | Tragic 96.9% |
| Cape Verdeans | 0.0 /100 | #312 | Tragic 96.9% |
| Guyanese | 0.0 /100 | #313 | Tragic 96.9% |
| Hondurans | 0.0 /100 | #314 | Tragic 96.9% |
| Immigrants | Belize | 0.0 /100 | #315 | Tragic 96.9% |
| Immigrants | Ecuador | 0.0 /100 | #316 | Tragic 96.9% |
| Immigrants | Nicaragua | 0.0 /100 | #317 | Tragic 96.9% |
| Immigrants | Laos | 0.0 /100 | #318 | Tragic 96.8% |
| Immigrants | Guyana | 0.0 /100 | #319 | Tragic 96.8% |
| Immigrants | Burma/Myanmar | 0.0 /100 | #320 | Tragic 96.8% |
| Immigrants | Bangladesh | 0.0 /100 | #321 | Tragic 96.8% |