Immigrants from Micronesia vs Japanese Male Disability
COMPARE
Immigrants from Micronesia
Japanese
Male Disability
Male Disability Comparison
Immigrants from Micronesia
Japanese
12.9%
MALE DISABILITY
0.0/ 100
METRIC RATING
295th/ 347
METRIC RANK
11.7%
MALE DISABILITY
3.1/ 100
METRIC RATING
224th/ 347
METRIC RANK
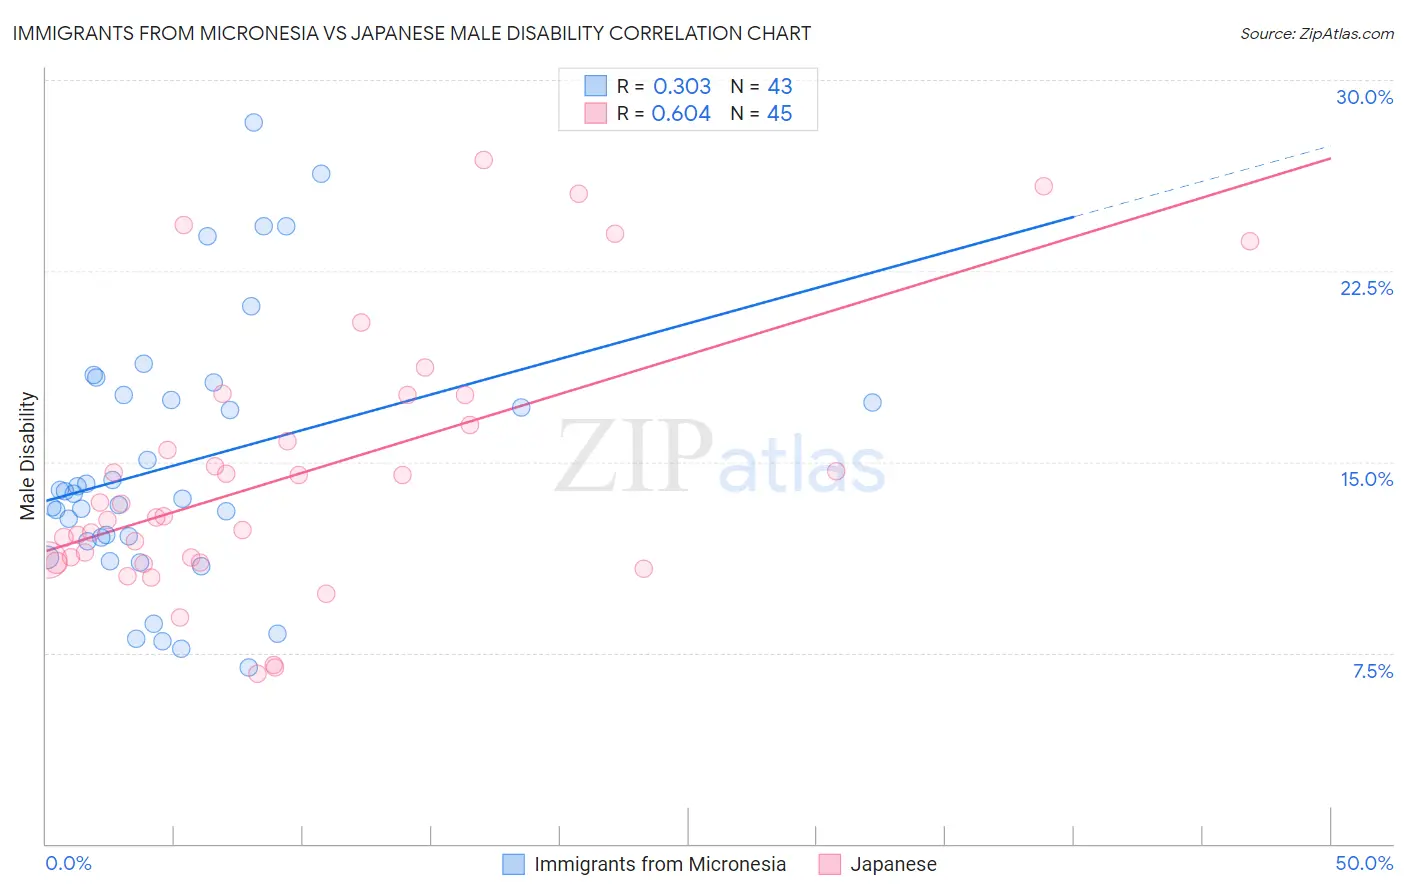
Immigrants from Micronesia vs Japanese Male Disability Correlation Chart
The statistical analysis conducted on geographies consisting of 61,603,826 people shows a mild positive correlation between the proportion of Immigrants from Micronesia and percentage of males with a disability in the United States with a correlation coefficient (R) of 0.303 and weighted average of 12.9%. Similarly, the statistical analysis conducted on geographies consisting of 249,159,975 people shows a significant positive correlation between the proportion of Japanese and percentage of males with a disability in the United States with a correlation coefficient (R) of 0.604 and weighted average of 11.7%, a difference of 10.0%.
Male Disability Correlation Summary
| Measurement | Immigrants from Micronesia | Japanese |
| Minimum | 6.9% | 6.7% |
| Maximum | 28.3% | 26.9% |
| Range | 21.4% | 20.2% |
| Mean | 14.9% | 14.5% |
| Median | 13.8% | 12.9% |
| Interquartile 25% (IQ1) | 11.9% | 11.1% |
| Interquartile 75% (IQ3) | 17.6% | 17.0% |
| Interquartile Range (IQR) | 5.7% | 5.9% |
| Standard Deviation (Sample) | 5.1% | 5.1% |
| Standard Deviation (Population) | 5.0% | 5.1% |
Similar Demographics by Male Disability
Demographics Similar to Immigrants from Micronesia by Male Disability
In terms of male disability, the demographic groups most similar to Immigrants from Micronesia are Nonimmigrants (12.9%, a difference of 0.070%), Marshallese (12.9%, a difference of 0.10%), Inupiat (13.0%, a difference of 0.17%), Yaqui (12.9%, a difference of 0.33%), and Pennsylvania German (13.0%, a difference of 0.37%).
| Demographics | Rating | Rank | Male Disability |
| Yup'ik | 0.0 /100 | #288 | Tragic 12.8% |
| Immigrants | Cabo Verde | 0.0 /100 | #289 | Tragic 12.8% |
| Pima | 0.0 /100 | #290 | Tragic 12.8% |
| Whites/Caucasians | 0.0 /100 | #291 | Tragic 12.8% |
| English | 0.0 /100 | #292 | Tragic 12.8% |
| Yaqui | 0.0 /100 | #293 | Tragic 12.9% |
| Marshallese | 0.0 /100 | #294 | Tragic 12.9% |
| Immigrants | Micronesia | 0.0 /100 | #295 | Tragic 12.9% |
| Immigrants | Nonimmigrants | 0.0 /100 | #296 | Tragic 12.9% |
| Inupiat | 0.0 /100 | #297 | Tragic 13.0% |
| Pennsylvania Germans | 0.0 /100 | #298 | Tragic 13.0% |
| Celtics | 0.0 /100 | #299 | Tragic 13.0% |
| Cheyenne | 0.0 /100 | #300 | Tragic 13.0% |
| French | 0.0 /100 | #301 | Tragic 13.0% |
| Crow | 0.0 /100 | #302 | Tragic 13.1% |
Demographics Similar to Japanese by Male Disability
In terms of male disability, the demographic groups most similar to Japanese are Liberian (11.8%, a difference of 0.010%), Immigrants from Bahamas (11.7%, a difference of 0.020%), Alsatian (11.7%, a difference of 0.11%), Subsaharan African (11.8%, a difference of 0.13%), and Immigrants from Congo (11.7%, a difference of 0.26%).
| Demographics | Rating | Rank | Male Disability |
| Immigrants | Dominica | 4.6 /100 | #217 | Tragic 11.7% |
| Immigrants | England | 4.0 /100 | #218 | Tragic 11.7% |
| Panamanians | 3.8 /100 | #219 | Tragic 11.7% |
| Immigrants | Western Europe | 3.8 /100 | #220 | Tragic 11.7% |
| Immigrants | Congo | 3.7 /100 | #221 | Tragic 11.7% |
| Alsatians | 3.3 /100 | #222 | Tragic 11.7% |
| Immigrants | Bahamas | 3.2 /100 | #223 | Tragic 11.7% |
| Japanese | 3.1 /100 | #224 | Tragic 11.7% |
| Liberians | 3.1 /100 | #225 | Tragic 11.8% |
| Sub-Saharan Africans | 2.8 /100 | #226 | Tragic 11.8% |
| Austrians | 2.5 /100 | #227 | Tragic 11.8% |
| Hispanics or Latinos | 2.3 /100 | #228 | Tragic 11.8% |
| Bermudans | 2.3 /100 | #229 | Tragic 11.8% |
| Croatians | 2.1 /100 | #230 | Tragic 11.8% |
| Dominicans | 1.8 /100 | #231 | Tragic 11.8% |