Immigrants from West Indies vs Honduran Male Disability
COMPARE
Immigrants from West Indies
Honduran
Male Disability
Male Disability Comparison
Immigrants from West Indies
Hondurans
11.1%
MALE DISABILITY
65.7/ 100
METRIC RATING
161st/ 347
METRIC RANK
11.3%
MALE DISABILITY
41.1/ 100
METRIC RATING
180th/ 347
METRIC RANK
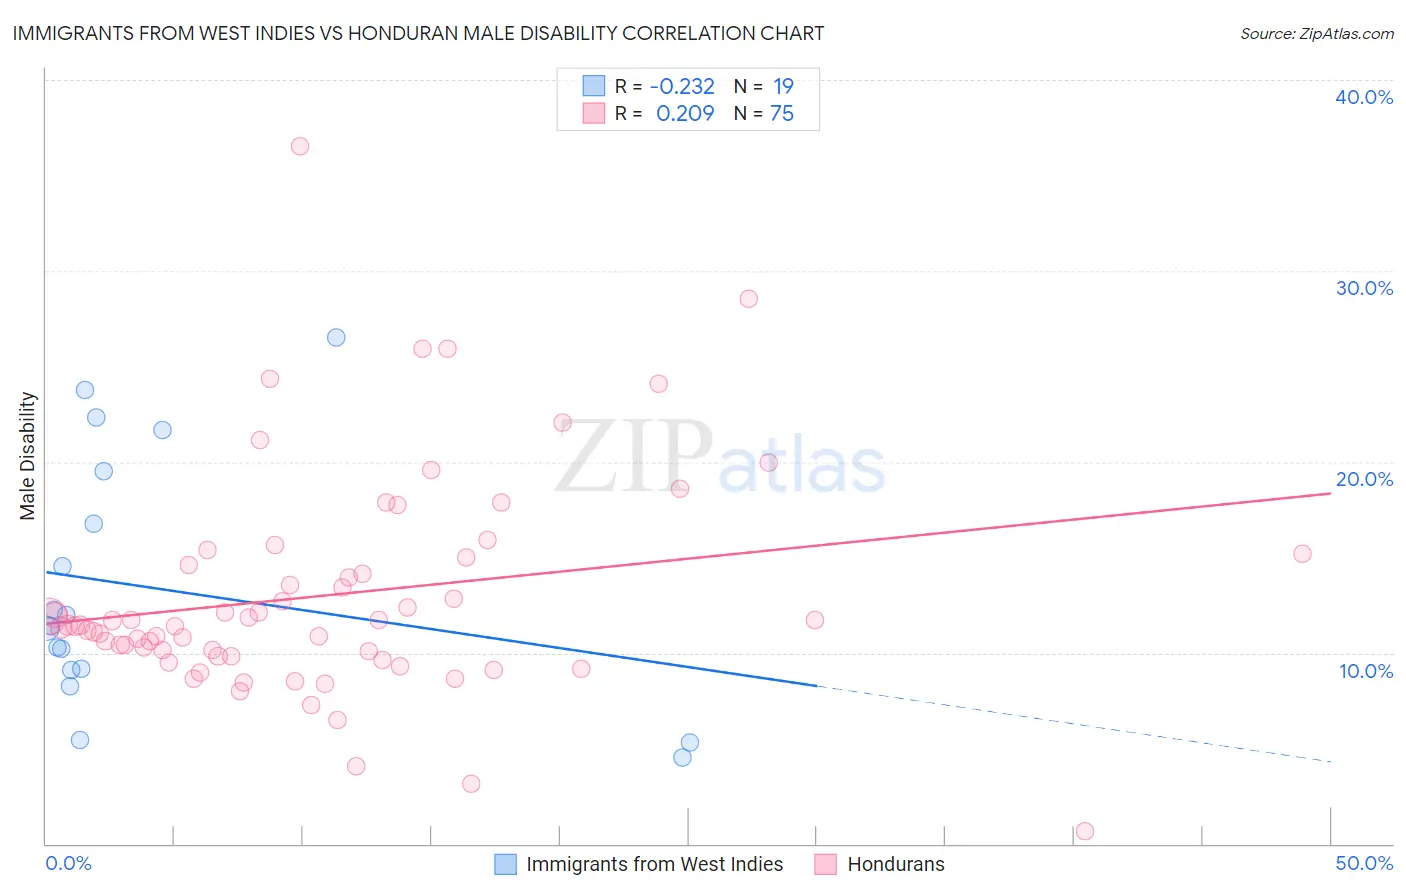
Immigrants from West Indies vs Honduran Male Disability Correlation Chart
The statistical analysis conducted on geographies consisting of 72,456,461 people shows a weak negative correlation between the proportion of Immigrants from West Indies and percentage of males with a disability in the United States with a correlation coefficient (R) of -0.232 and weighted average of 11.1%. Similarly, the statistical analysis conducted on geographies consisting of 357,765,878 people shows a weak positive correlation between the proportion of Hondurans and percentage of males with a disability in the United States with a correlation coefficient (R) of 0.209 and weighted average of 11.3%, a difference of 1.4%.
Male Disability Correlation Summary
| Measurement | Immigrants from West Indies | Honduran |
| Minimum | 4.5% | 0.65% |
| Maximum | 26.5% | 36.5% |
| Range | 22.0% | 35.9% |
| Mean | 13.4% | 13.0% |
| Median | 11.4% | 11.4% |
| Interquartile 25% (IQ1) | 9.1% | 9.8% |
| Interquartile 75% (IQ3) | 19.5% | 15.0% |
| Interquartile Range (IQR) | 10.4% | 5.1% |
| Standard Deviation (Sample) | 6.6% | 5.8% |
| Standard Deviation (Population) | 6.4% | 5.8% |
Demographics Similar to Immigrants from West Indies and Hondurans by Male Disability
In terms of male disability, the demographic groups most similar to Immigrants from West Indies are Immigrants from Haiti (11.1%, a difference of 0.020%), Albanian (11.1%, a difference of 0.050%), Immigrants from Kenya (11.1%, a difference of 0.12%), British West Indian (11.1%, a difference of 0.18%), and Luxembourger (11.1%, a difference of 0.23%). Similarly, the demographic groups most similar to Hondurans are Immigrants from Caribbean (11.3%, a difference of 0.020%), Australian (11.3%, a difference of 0.060%), Immigrants from Norway (11.3%, a difference of 0.17%), Syrian (11.2%, a difference of 0.31%), and Immigrants from Honduras (11.2%, a difference of 0.42%).
| Demographics | Rating | Rank | Male Disability |
| Albanians | 66.5 /100 | #160 | Good 11.1% |
| Immigrants | West Indies | 65.7 /100 | #161 | Good 11.1% |
| Immigrants | Haiti | 65.3 /100 | #162 | Good 11.1% |
| Immigrants | Kenya | 63.8 /100 | #163 | Good 11.1% |
| British West Indians | 62.8 /100 | #164 | Good 11.1% |
| Luxembourgers | 61.9 /100 | #165 | Good 11.1% |
| Immigrants | Hungary | 61.2 /100 | #166 | Good 11.1% |
| Immigrants | Southern Europe | 54.4 /100 | #167 | Average 11.2% |
| Immigrants | Latin America | 54.0 /100 | #168 | Average 11.2% |
| Barbadians | 53.4 /100 | #169 | Average 11.2% |
| New Zealanders | 52.9 /100 | #170 | Average 11.2% |
| Haitians | 52.5 /100 | #171 | Average 11.2% |
| Romanians | 50.7 /100 | #172 | Average 11.2% |
| Immigrants | Burma/Myanmar | 50.4 /100 | #173 | Average 11.2% |
| Maltese | 50.0 /100 | #174 | Average 11.2% |
| Immigrants | Honduras | 48.7 /100 | #175 | Average 11.2% |
| Syrians | 46.6 /100 | #176 | Average 11.2% |
| Immigrants | Norway | 44.2 /100 | #177 | Average 11.3% |
| Australians | 42.2 /100 | #178 | Average 11.3% |
| Immigrants | Caribbean | 41.4 /100 | #179 | Average 11.3% |
| Hondurans | 41.1 /100 | #180 | Average 11.3% |