Immigrants from Micronesia vs Slavic Male Disability
COMPARE
Immigrants from Micronesia
Slavic
Male Disability
Male Disability Comparison
Immigrants from Micronesia
Slavs
12.9%
MALE DISABILITY
0.0/ 100
METRIC RATING
295th/ 347
METRIC RANK
12.2%
MALE DISABILITY
0.2/ 100
METRIC RATING
261st/ 347
METRIC RANK
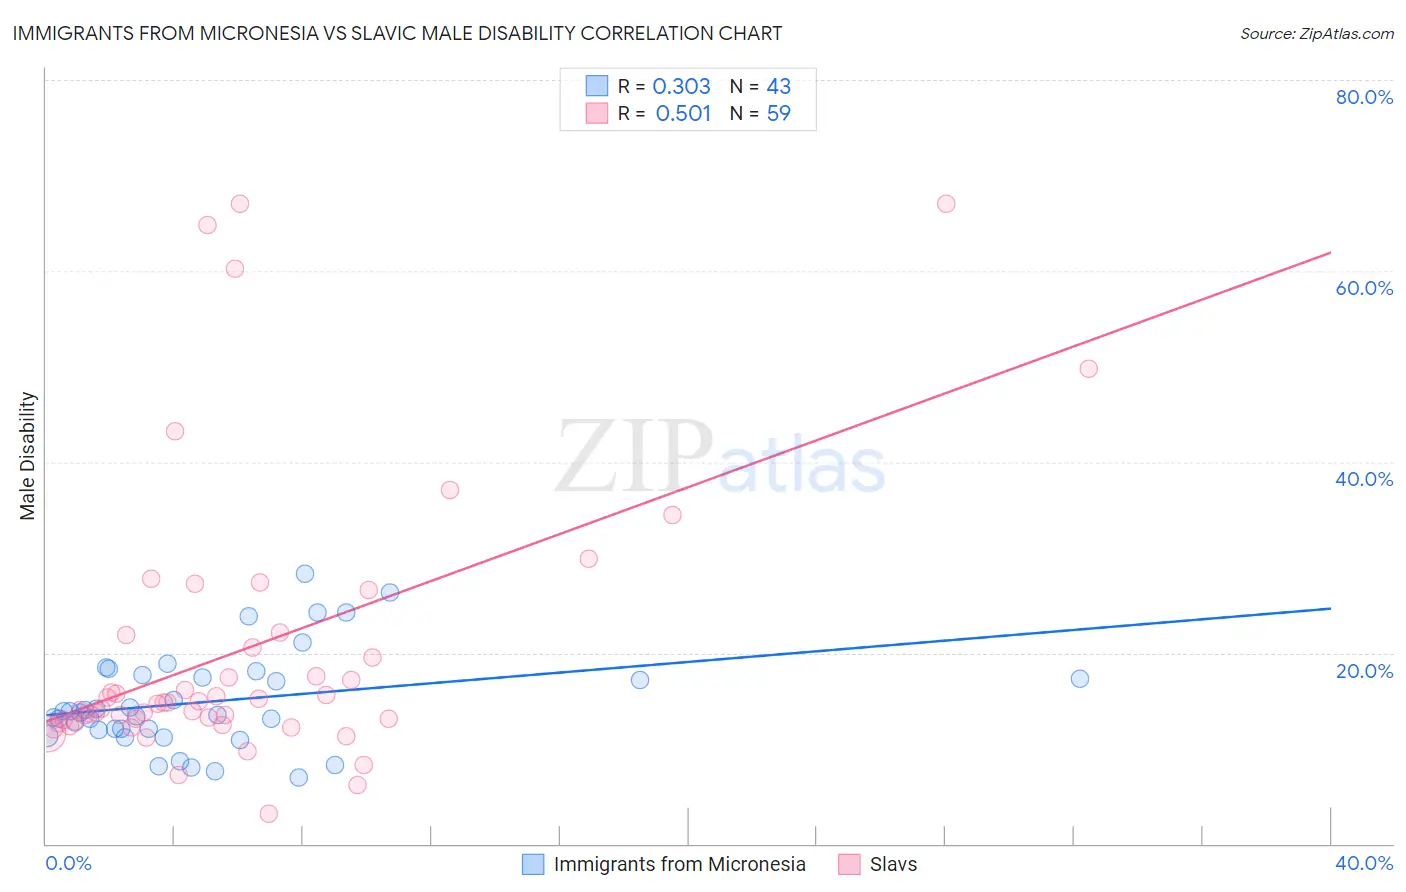
Immigrants from Micronesia vs Slavic Male Disability Correlation Chart
The statistical analysis conducted on geographies consisting of 61,603,826 people shows a mild positive correlation between the proportion of Immigrants from Micronesia and percentage of males with a disability in the United States with a correlation coefficient (R) of 0.303 and weighted average of 12.9%. Similarly, the statistical analysis conducted on geographies consisting of 270,856,634 people shows a substantial positive correlation between the proportion of Slavs and percentage of males with a disability in the United States with a correlation coefficient (R) of 0.501 and weighted average of 12.2%, a difference of 6.2%.
Male Disability Correlation Summary
| Measurement | Immigrants from Micronesia | Slavic |
| Minimum | 6.9% | 3.2% |
| Maximum | 28.3% | 67.0% |
| Range | 21.4% | 63.9% |
| Mean | 14.9% | 20.3% |
| Median | 13.8% | 14.8% |
| Interquartile 25% (IQ1) | 11.9% | 12.8% |
| Interquartile 75% (IQ3) | 17.6% | 21.9% |
| Interquartile Range (IQR) | 5.7% | 9.1% |
| Standard Deviation (Sample) | 5.1% | 14.7% |
| Standard Deviation (Population) | 5.0% | 14.6% |
Similar Demographics by Male Disability
Demographics Similar to Immigrants from Micronesia by Male Disability
In terms of male disability, the demographic groups most similar to Immigrants from Micronesia are Nonimmigrants (12.9%, a difference of 0.070%), Marshallese (12.9%, a difference of 0.10%), Inupiat (13.0%, a difference of 0.17%), Yaqui (12.9%, a difference of 0.33%), and Pennsylvania German (13.0%, a difference of 0.37%).
| Demographics | Rating | Rank | Male Disability |
| Yup'ik | 0.0 /100 | #288 | Tragic 12.8% |
| Immigrants | Cabo Verde | 0.0 /100 | #289 | Tragic 12.8% |
| Pima | 0.0 /100 | #290 | Tragic 12.8% |
| Whites/Caucasians | 0.0 /100 | #291 | Tragic 12.8% |
| English | 0.0 /100 | #292 | Tragic 12.8% |
| Yaqui | 0.0 /100 | #293 | Tragic 12.9% |
| Marshallese | 0.0 /100 | #294 | Tragic 12.9% |
| Immigrants | Micronesia | 0.0 /100 | #295 | Tragic 12.9% |
| Immigrants | Nonimmigrants | 0.0 /100 | #296 | Tragic 12.9% |
| Inupiat | 0.0 /100 | #297 | Tragic 13.0% |
| Pennsylvania Germans | 0.0 /100 | #298 | Tragic 13.0% |
| Celtics | 0.0 /100 | #299 | Tragic 13.0% |
| Cheyenne | 0.0 /100 | #300 | Tragic 13.0% |
| French | 0.0 /100 | #301 | Tragic 13.0% |
| Crow | 0.0 /100 | #302 | Tragic 13.1% |
Demographics Similar to Slavs by Male Disability
In terms of male disability, the demographic groups most similar to Slavs are Norwegian (12.2%, a difference of 0.010%), Canadian (12.2%, a difference of 0.21%), Nepalese (12.2%, a difference of 0.25%), Swedish (12.1%, a difference of 0.36%), and Belgian (12.1%, a difference of 0.43%).
| Demographics | Rating | Rank | Male Disability |
| British | 0.4 /100 | #254 | Tragic 12.1% |
| Chinese | 0.4 /100 | #255 | Tragic 12.1% |
| Swiss | 0.3 /100 | #256 | Tragic 12.1% |
| Europeans | 0.3 /100 | #257 | Tragic 12.1% |
| Basques | 0.3 /100 | #258 | Tragic 12.1% |
| Belgians | 0.3 /100 | #259 | Tragic 12.1% |
| Swedes | 0.3 /100 | #260 | Tragic 12.1% |
| Slavs | 0.2 /100 | #261 | Tragic 12.2% |
| Norwegians | 0.2 /100 | #262 | Tragic 12.2% |
| Canadians | 0.2 /100 | #263 | Tragic 12.2% |
| Nepalese | 0.2 /100 | #264 | Tragic 12.2% |
| Immigrants | Portugal | 0.1 /100 | #265 | Tragic 12.3% |
| Hawaiians | 0.1 /100 | #266 | Tragic 12.3% |
| Immigrants | Germany | 0.1 /100 | #267 | Tragic 12.3% |
| Portuguese | 0.1 /100 | #268 | Tragic 12.3% |