Immigrants from Australia vs Honduran Male Disability
COMPARE
Immigrants from Australia
Honduran
Male Disability
Male Disability Comparison
Immigrants from Australia
Hondurans
10.4%
MALE DISABILITY
99.5/ 100
METRIC RATING
59th/ 347
METRIC RANK
11.3%
MALE DISABILITY
41.1/ 100
METRIC RATING
180th/ 347
METRIC RANK
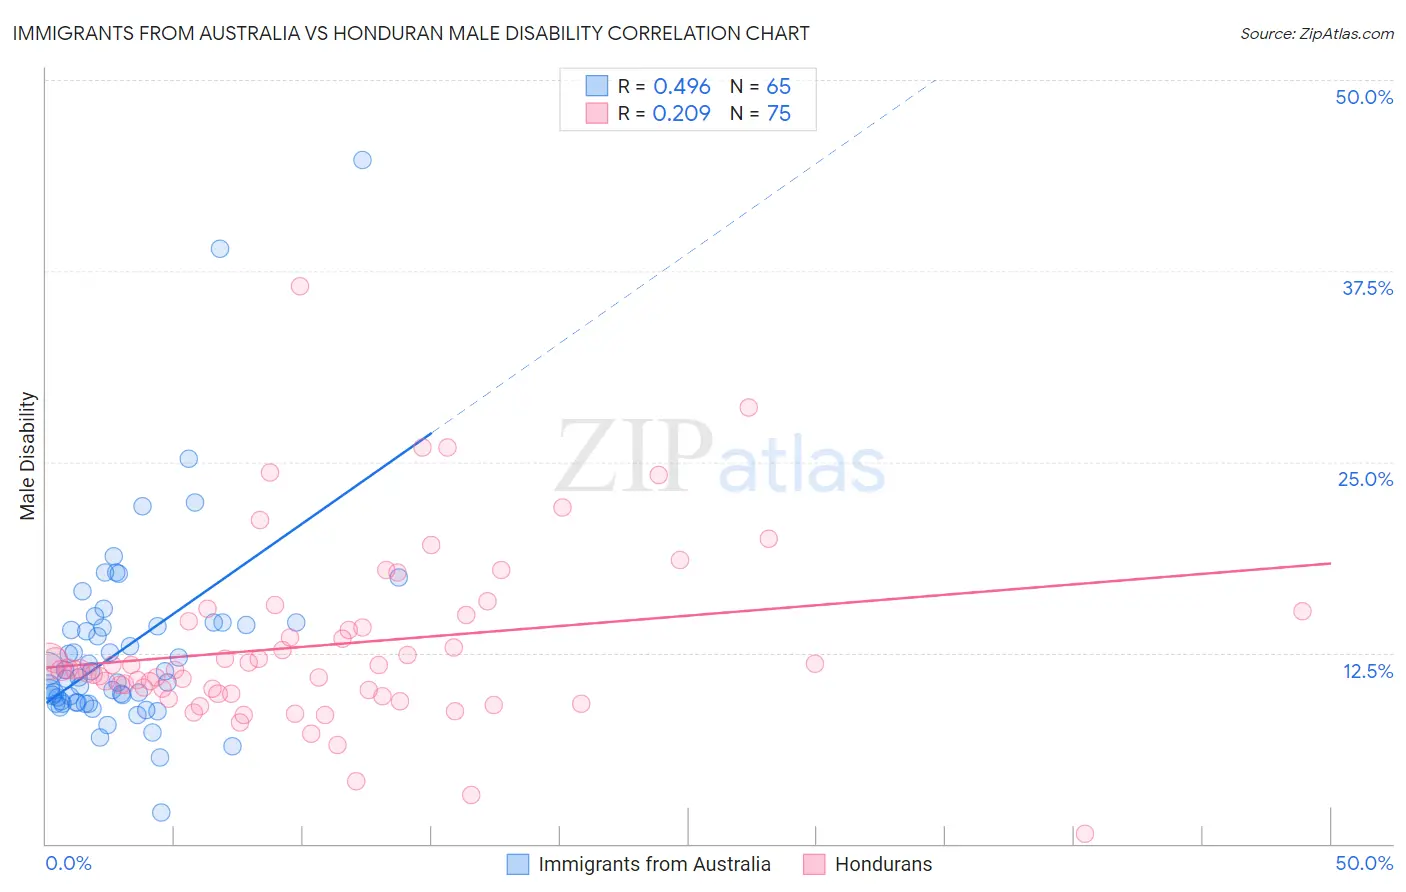
Immigrants from Australia vs Honduran Male Disability Correlation Chart
The statistical analysis conducted on geographies consisting of 227,204,405 people shows a moderate positive correlation between the proportion of Immigrants from Australia and percentage of males with a disability in the United States with a correlation coefficient (R) of 0.496 and weighted average of 10.4%. Similarly, the statistical analysis conducted on geographies consisting of 357,765,878 people shows a weak positive correlation between the proportion of Hondurans and percentage of males with a disability in the United States with a correlation coefficient (R) of 0.209 and weighted average of 11.3%, a difference of 8.4%.
Male Disability Correlation Summary
| Measurement | Immigrants from Australia | Honduran |
| Minimum | 2.0% | 0.65% |
| Maximum | 44.7% | 36.5% |
| Range | 42.7% | 35.9% |
| Mean | 12.8% | 13.0% |
| Median | 10.9% | 11.4% |
| Interquartile 25% (IQ1) | 9.2% | 9.8% |
| Interquartile 75% (IQ3) | 14.4% | 15.0% |
| Interquartile Range (IQR) | 5.2% | 5.1% |
| Standard Deviation (Sample) | 6.6% | 5.8% |
| Standard Deviation (Population) | 6.6% | 5.8% |
Similar Demographics by Male Disability
Demographics Similar to Immigrants from Australia by Male Disability
In terms of male disability, the demographic groups most similar to Immigrants from Australia are Immigrants from Colombia (10.4%, a difference of 0.060%), Immigrants from Japan (10.4%, a difference of 0.14%), Immigrants from Northern Africa (10.4%, a difference of 0.15%), Immigrants from South America (10.4%, a difference of 0.22%), and Tongan (10.4%, a difference of 0.24%).
| Demographics | Rating | Rank | Male Disability |
| Immigrants | Saudi Arabia | 99.6 /100 | #52 | Exceptional 10.4% |
| Immigrants | Uzbekistan | 99.6 /100 | #53 | Exceptional 10.4% |
| Peruvians | 99.6 /100 | #54 | Exceptional 10.4% |
| Immigrants | Eritrea | 99.6 /100 | #55 | Exceptional 10.4% |
| Tongans | 99.6 /100 | #56 | Exceptional 10.4% |
| Immigrants | South America | 99.6 /100 | #57 | Exceptional 10.4% |
| Immigrants | Japan | 99.5 /100 | #58 | Exceptional 10.4% |
| Immigrants | Australia | 99.5 /100 | #59 | Exceptional 10.4% |
| Immigrants | Colombia | 99.5 /100 | #60 | Exceptional 10.4% |
| Immigrants | Northern Africa | 99.4 /100 | #61 | Exceptional 10.4% |
| Immigrants | Ecuador | 99.3 /100 | #62 | Exceptional 10.4% |
| Immigrants | Belarus | 99.3 /100 | #63 | Exceptional 10.4% |
| Jordanians | 99.3 /100 | #64 | Exceptional 10.5% |
| Immigrants | Grenada | 99.2 /100 | #65 | Exceptional 10.5% |
| Guyanese | 99.2 /100 | #66 | Exceptional 10.5% |
Demographics Similar to Hondurans by Male Disability
In terms of male disability, the demographic groups most similar to Hondurans are Immigrants from Caribbean (11.3%, a difference of 0.020%), Australian (11.3%, a difference of 0.060%), Immigrants from Norway (11.3%, a difference of 0.17%), Syrian (11.2%, a difference of 0.31%), and Immigrants from Senegal (11.3%, a difference of 0.40%).
| Demographics | Rating | Rank | Male Disability |
| Immigrants | Burma/Myanmar | 50.4 /100 | #173 | Average 11.2% |
| Maltese | 50.0 /100 | #174 | Average 11.2% |
| Immigrants | Honduras | 48.7 /100 | #175 | Average 11.2% |
| Syrians | 46.6 /100 | #176 | Average 11.2% |
| Immigrants | Norway | 44.2 /100 | #177 | Average 11.3% |
| Australians | 42.2 /100 | #178 | Average 11.3% |
| Immigrants | Caribbean | 41.4 /100 | #179 | Average 11.3% |
| Hondurans | 41.1 /100 | #180 | Average 11.3% |
| Immigrants | Senegal | 34.4 /100 | #181 | Fair 11.3% |
| Immigrants | Belize | 33.7 /100 | #182 | Fair 11.3% |
| Immigrants | Central America | 32.9 /100 | #183 | Fair 11.3% |
| Iraqis | 30.5 /100 | #184 | Fair 11.3% |
| Pakistanis | 30.3 /100 | #185 | Fair 11.3% |
| Immigrants | Zaire | 27.6 /100 | #186 | Fair 11.4% |
| Immigrants | Austria | 27.3 /100 | #187 | Fair 11.4% |