Immigrants from Micronesia vs Honduran 11th Grade
COMPARE
Immigrants from Micronesia
Honduran
11th Grade
11th Grade Comparison
Immigrants from Micronesia
Hondurans
92.2%
11TH GRADE
17.7/ 100
METRIC RATING
211th/ 347
METRIC RANK
87.4%
11TH GRADE
0.0/ 100
METRIC RATING
330th/ 347
METRIC RANK
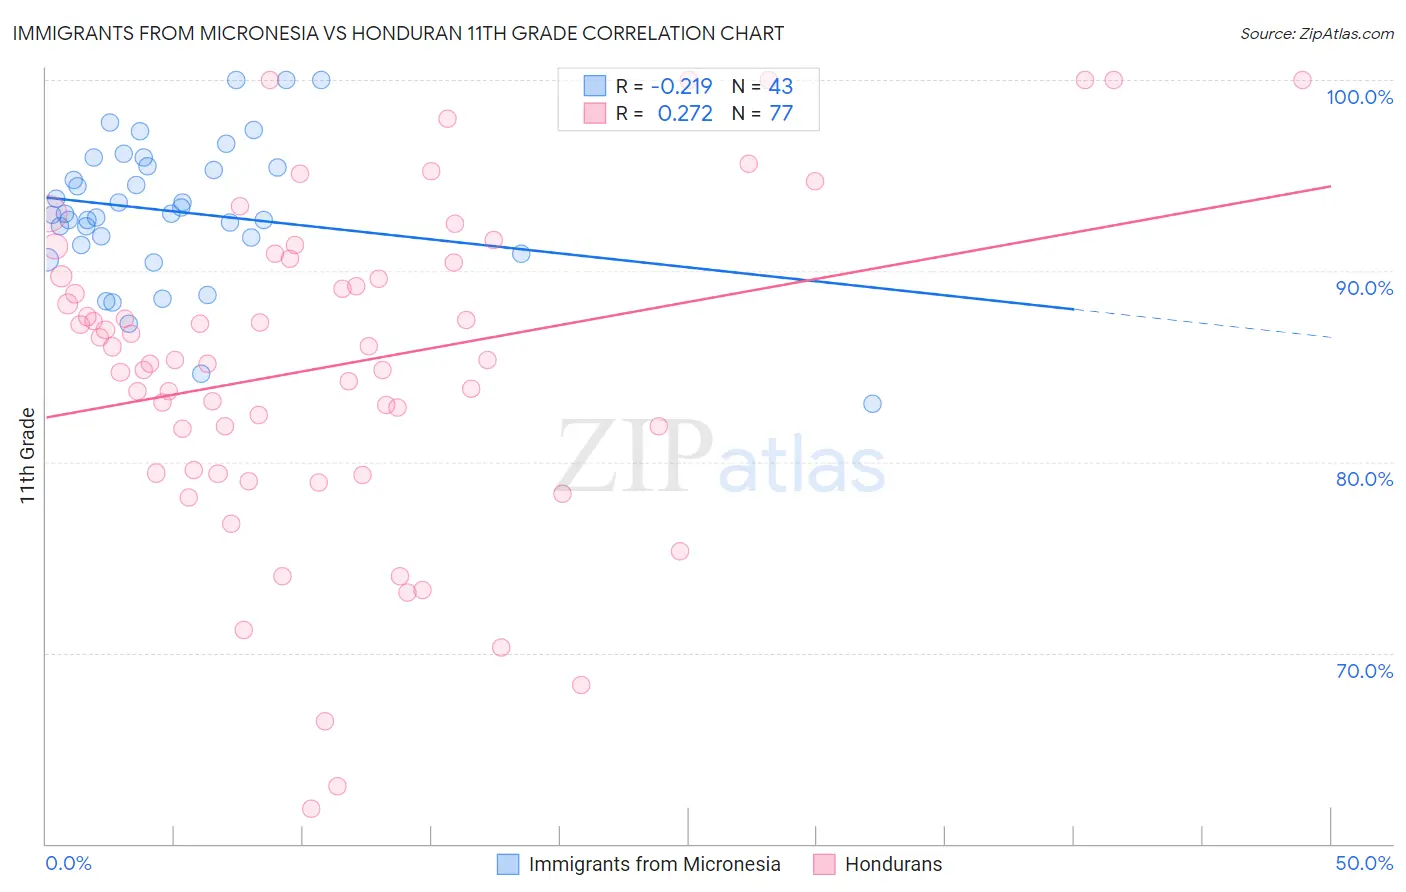
Immigrants from Micronesia vs Honduran 11th Grade Correlation Chart
The statistical analysis conducted on geographies consisting of 61,604,657 people shows a weak negative correlation between the proportion of Immigrants from Micronesia and percentage of population with at least 11th grade education in the United States with a correlation coefficient (R) of -0.219 and weighted average of 92.2%. Similarly, the statistical analysis conducted on geographies consisting of 357,858,827 people shows a weak positive correlation between the proportion of Hondurans and percentage of population with at least 11th grade education in the United States with a correlation coefficient (R) of 0.272 and weighted average of 87.4%, a difference of 5.5%.
11th Grade Correlation Summary
| Measurement | Immigrants from Micronesia | Honduran |
| Minimum | 83.0% | 61.9% |
| Maximum | 100.0% | 100.0% |
| Range | 17.0% | 38.1% |
| Mean | 93.1% | 85.1% |
| Median | 93.0% | 85.4% |
| Interquartile 25% (IQ1) | 91.4% | 79.5% |
| Interquartile 75% (IQ3) | 95.5% | 90.5% |
| Interquartile Range (IQR) | 4.1% | 11.0% |
| Standard Deviation (Sample) | 3.7% | 8.6% |
| Standard Deviation (Population) | 3.7% | 8.5% |
Similar Demographics by 11th Grade
Demographics Similar to Immigrants from Micronesia by 11th Grade
In terms of 11th grade, the demographic groups most similar to Immigrants from Micronesia are Ethiopian (92.2%, a difference of 0.020%), Tongan (92.2%, a difference of 0.030%), Colville (92.2%, a difference of 0.060%), Korean (92.1%, a difference of 0.060%), and Immigrants from Oceania (92.2%, a difference of 0.070%).
| Demographics | Rating | Rank | 11th Grade |
| Immigrants | Hong Kong | 23.3 /100 | #204 | Fair 92.2% |
| Kiowa | 23.2 /100 | #205 | Fair 92.2% |
| Bolivians | 23.2 /100 | #206 | Fair 92.2% |
| Immigrants | Oceania | 22.4 /100 | #207 | Fair 92.2% |
| Colville | 21.8 /100 | #208 | Fair 92.2% |
| Tongans | 19.8 /100 | #209 | Poor 92.2% |
| Ethiopians | 18.8 /100 | #210 | Poor 92.2% |
| Immigrants | Micronesia | 17.7 /100 | #211 | Poor 92.2% |
| Koreans | 14.4 /100 | #212 | Poor 92.1% |
| Immigrants | Ethiopia | 13.9 /100 | #213 | Poor 92.1% |
| Afghans | 12.8 /100 | #214 | Poor 92.1% |
| Immigrants | Southern Europe | 12.5 /100 | #215 | Poor 92.1% |
| Somalis | 11.6 /100 | #216 | Poor 92.1% |
| Immigrants | Sierra Leone | 11.1 /100 | #217 | Poor 92.0% |
| Blackfeet | 10.1 /100 | #218 | Poor 92.0% |
Demographics Similar to Hondurans by 11th Grade
In terms of 11th grade, the demographic groups most similar to Hondurans are Hispanic or Latino (87.3%, a difference of 0.060%), Immigrants from the Azores (87.2%, a difference of 0.16%), Mexican American Indian (87.5%, a difference of 0.19%), Tohono O'odham (87.6%, a difference of 0.26%), and Immigrants from Cabo Verde (87.6%, a difference of 0.31%).
| Demographics | Rating | Rank | 11th Grade |
| Pima | 0.0 /100 | #323 | Tragic 88.3% |
| Central American Indians | 0.0 /100 | #324 | Tragic 88.2% |
| Immigrants | Nicaragua | 0.0 /100 | #325 | Tragic 88.1% |
| Dominicans | 0.0 /100 | #326 | Tragic 87.7% |
| Immigrants | Cabo Verde | 0.0 /100 | #327 | Tragic 87.6% |
| Tohono O'odham | 0.0 /100 | #328 | Tragic 87.6% |
| Mexican American Indians | 0.0 /100 | #329 | Tragic 87.5% |
| Hondurans | 0.0 /100 | #330 | Tragic 87.4% |
| Hispanics or Latinos | 0.0 /100 | #331 | Tragic 87.3% |
| Immigrants | Azores | 0.0 /100 | #332 | Tragic 87.2% |
| Immigrants | Yemen | 0.0 /100 | #333 | Tragic 87.1% |
| Houma | 0.0 /100 | #334 | Tragic 87.0% |
| Central Americans | 0.0 /100 | #335 | Tragic 86.9% |
| Immigrants | Dominican Republic | 0.0 /100 | #336 | Tragic 86.9% |
| Immigrants | Honduras | 0.0 /100 | #337 | Tragic 86.9% |