Immigrants from Mexico vs Immigrants from Romania Disability
COMPARE
Immigrants from Mexico
Immigrants from Romania
Disability
Disability Comparison
Immigrants from Mexico
Immigrants from Romania
11.9%
DISABILITY
23.8/ 100
METRIC RATING
188th/ 347
METRIC RANK
11.2%
DISABILITY
98.5/ 100
METRIC RATING
88th/ 347
METRIC RANK
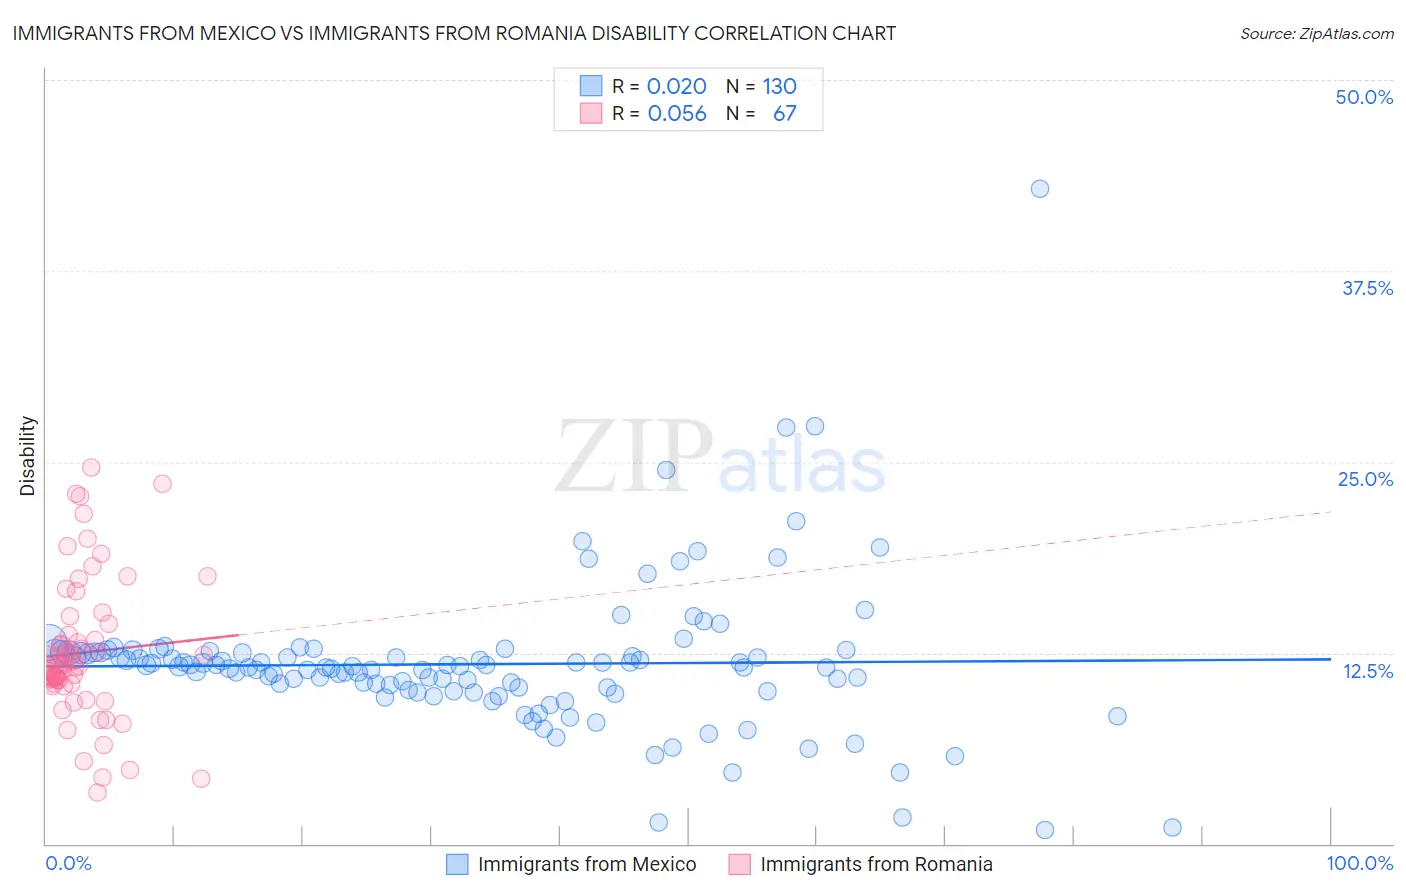
Immigrants from Mexico vs Immigrants from Romania Disability Correlation Chart
The statistical analysis conducted on geographies consisting of 513,610,494 people shows no correlation between the proportion of Immigrants from Mexico and percentage of population with a disability in the United States with a correlation coefficient (R) of 0.020 and weighted average of 11.9%. Similarly, the statistical analysis conducted on geographies consisting of 256,993,596 people shows a slight positive correlation between the proportion of Immigrants from Romania and percentage of population with a disability in the United States with a correlation coefficient (R) of 0.056 and weighted average of 11.2%, a difference of 6.2%.
Disability Correlation Summary
| Measurement | Immigrants from Mexico | Immigrants from Romania |
| Minimum | 0.89% | 3.4% |
| Maximum | 42.9% | 24.6% |
| Range | 42.0% | 21.3% |
| Mean | 11.8% | 12.5% |
| Median | 11.6% | 11.6% |
| Interquartile 25% (IQ1) | 10.1% | 10.4% |
| Interquartile 75% (IQ3) | 12.5% | 14.4% |
| Interquartile Range (IQR) | 2.4% | 3.9% |
| Standard Deviation (Sample) | 4.9% | 4.6% |
| Standard Deviation (Population) | 4.8% | 4.6% |
Similar Demographics by Disability
Demographics Similar to Immigrants from Mexico by Disability
In terms of disability, the demographic groups most similar to Immigrants from Mexico are Immigrants from Zaire (11.9%, a difference of 0.12%), Immigrants from West Indies (11.9%, a difference of 0.17%), Lebanese (11.8%, a difference of 0.24%), Immigrants from Scotland (11.8%, a difference of 0.26%), and Immigrants from Burma/Myanmar (11.8%, a difference of 0.27%).
| Demographics | Rating | Rank | Disability |
| Immigrants | Oceania | 34.3 /100 | #181 | Fair 11.8% |
| Icelanders | 34.0 /100 | #182 | Fair 11.8% |
| Hondurans | 31.2 /100 | #183 | Fair 11.8% |
| Iraqis | 30.0 /100 | #184 | Fair 11.8% |
| Immigrants | Burma/Myanmar | 28.5 /100 | #185 | Fair 11.8% |
| Immigrants | Scotland | 28.2 /100 | #186 | Fair 11.8% |
| Lebanese | 27.9 /100 | #187 | Fair 11.8% |
| Immigrants | Mexico | 23.8 /100 | #188 | Fair 11.9% |
| Immigrants | Zaire | 21.8 /100 | #189 | Fair 11.9% |
| Immigrants | West Indies | 21.1 /100 | #190 | Fair 11.9% |
| Ute | 19.5 /100 | #191 | Poor 11.9% |
| Lithuanians | 18.8 /100 | #192 | Poor 11.9% |
| Immigrants | Bosnia and Herzegovina | 18.0 /100 | #193 | Poor 11.9% |
| Somalis | 17.3 /100 | #194 | Poor 11.9% |
| Barbadians | 15.8 /100 | #195 | Poor 11.9% |
Demographics Similar to Immigrants from Romania by Disability
In terms of disability, the demographic groups most similar to Immigrants from Romania are Immigrants from South Africa (11.2%, a difference of 0.25%), Palestinian (11.1%, a difference of 0.29%), Immigrants from Brazil (11.2%, a difference of 0.30%), Immigrants from Western Asia (11.2%, a difference of 0.32%), and Immigrants from Belarus (11.1%, a difference of 0.33%).
| Demographics | Rating | Rank | Disability |
| Immigrants | Poland | 99.1 /100 | #81 | Exceptional 11.1% |
| Chileans | 99.1 /100 | #82 | Exceptional 11.1% |
| Immigrants | Switzerland | 99.0 /100 | #83 | Exceptional 11.1% |
| Immigrants | Sierra Leone | 99.0 /100 | #84 | Exceptional 11.1% |
| Immigrants | Belarus | 98.9 /100 | #85 | Exceptional 11.1% |
| Immigrants | Russia | 98.9 /100 | #86 | Exceptional 11.1% |
| Palestinians | 98.9 /100 | #87 | Exceptional 11.1% |
| Immigrants | Romania | 98.5 /100 | #88 | Exceptional 11.2% |
| Immigrants | South Africa | 98.2 /100 | #89 | Exceptional 11.2% |
| Immigrants | Brazil | 98.1 /100 | #90 | Exceptional 11.2% |
| Immigrants | Western Asia | 98.1 /100 | #91 | Exceptional 11.2% |
| Ecuadorians | 98.0 /100 | #92 | Exceptional 11.2% |
| Immigrants | Ecuador | 98.0 /100 | #93 | Exceptional 11.2% |
| Immigrants | Morocco | 97.8 /100 | #94 | Exceptional 11.2% |
| Eastern Europeans | 97.8 /100 | #95 | Exceptional 11.2% |