Immigrants from Mexico vs Immigrants from Caribbean Disability
COMPARE
Immigrants from Mexico
Immigrants from Caribbean
Disability
Disability Comparison
Immigrants from Mexico
Immigrants from Caribbean
11.9%
DISABILITY
23.8/ 100
METRIC RATING
188th/ 347
METRIC RANK
12.0%
DISABILITY
9.1/ 100
METRIC RATING
208th/ 347
METRIC RANK
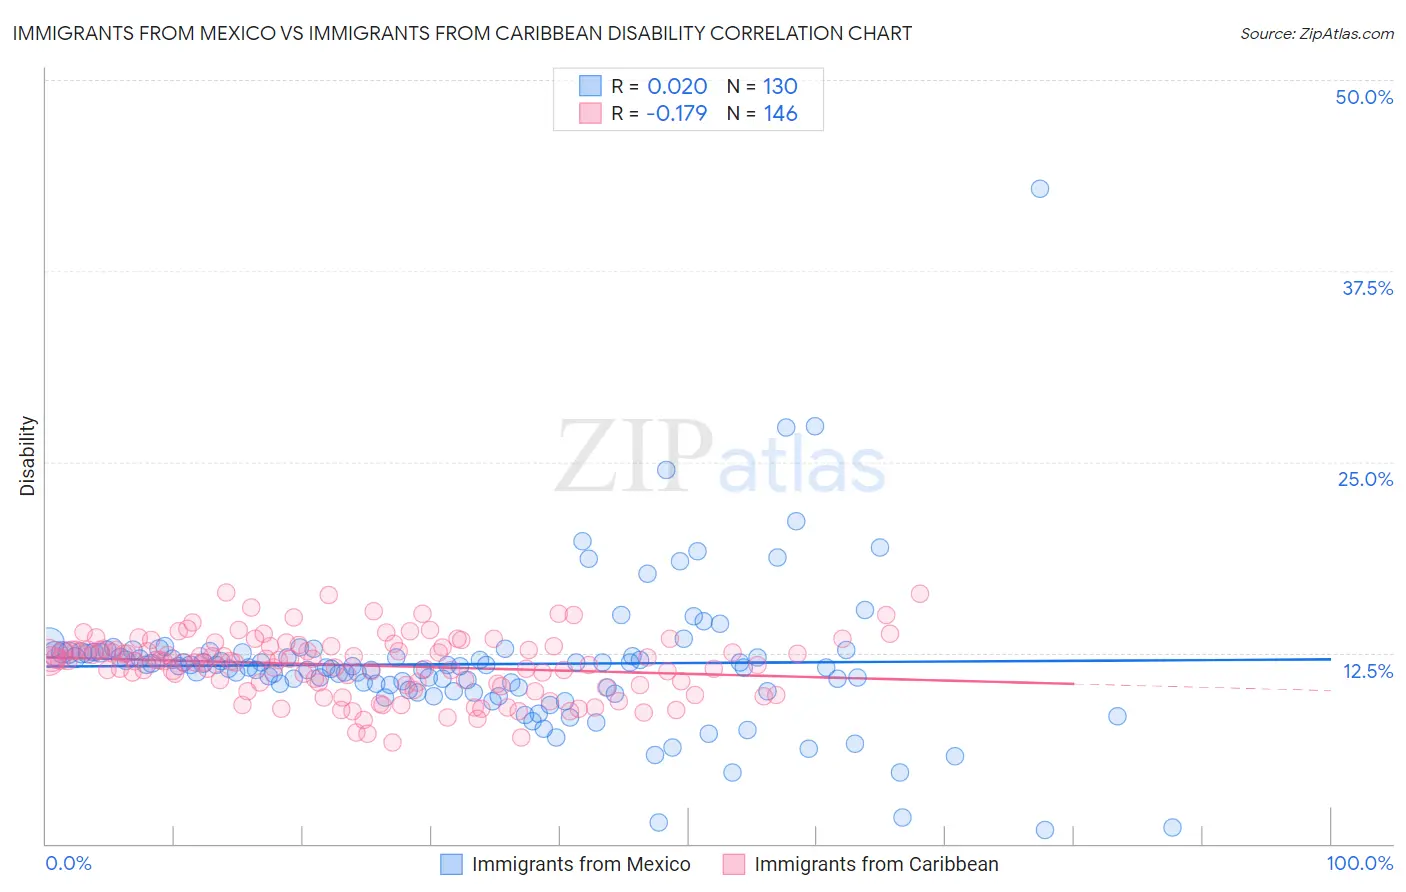
Immigrants from Mexico vs Immigrants from Caribbean Disability Correlation Chart
The statistical analysis conducted on geographies consisting of 513,610,494 people shows no correlation between the proportion of Immigrants from Mexico and percentage of population with a disability in the United States with a correlation coefficient (R) of 0.020 and weighted average of 11.9%. Similarly, the statistical analysis conducted on geographies consisting of 449,955,914 people shows a poor negative correlation between the proportion of Immigrants from Caribbean and percentage of population with a disability in the United States with a correlation coefficient (R) of -0.179 and weighted average of 12.0%, a difference of 1.2%.
Disability Correlation Summary
| Measurement | Immigrants from Mexico | Immigrants from Caribbean |
| Minimum | 0.89% | 6.6% |
| Maximum | 42.9% | 16.5% |
| Range | 42.0% | 9.9% |
| Mean | 11.8% | 11.7% |
| Median | 11.6% | 12.0% |
| Interquartile 25% (IQ1) | 10.1% | 10.4% |
| Interquartile 75% (IQ3) | 12.5% | 12.8% |
| Interquartile Range (IQR) | 2.4% | 2.5% |
| Standard Deviation (Sample) | 4.9% | 2.0% |
| Standard Deviation (Population) | 4.8% | 2.0% |
Demographics Similar to Immigrants from Mexico and Immigrants from Caribbean by Disability
In terms of disability, the demographic groups most similar to Immigrants from Mexico are Immigrants from Zaire (11.9%, a difference of 0.12%), Immigrants from West Indies (11.9%, a difference of 0.17%), Ute (11.9%, a difference of 0.28%), Lithuanian (11.9%, a difference of 0.33%), and Immigrants from Bosnia and Herzegovina (11.9%, a difference of 0.38%). Similarly, the demographic groups most similar to Immigrants from Caribbean are Immigrants from Thailand (12.0%, a difference of 0.020%), Immigrants from Senegal (12.0%, a difference of 0.040%), Immigrants from Western Europe (12.0%, a difference of 0.12%), British West Indian (12.0%, a difference of 0.28%), and Mexican American Indian (12.0%, a difference of 0.28%).
| Demographics | Rating | Rank | Disability |
| Immigrants | Mexico | 23.8 /100 | #188 | Fair 11.9% |
| Immigrants | Zaire | 21.8 /100 | #189 | Fair 11.9% |
| Immigrants | West Indies | 21.1 /100 | #190 | Fair 11.9% |
| Ute | 19.5 /100 | #191 | Poor 11.9% |
| Lithuanians | 18.8 /100 | #192 | Poor 11.9% |
| Immigrants | Bosnia and Herzegovina | 18.0 /100 | #193 | Poor 11.9% |
| Somalis | 17.3 /100 | #194 | Poor 11.9% |
| Barbadians | 15.8 /100 | #195 | Poor 11.9% |
| Serbians | 15.4 /100 | #196 | Poor 11.9% |
| Immigrants | Belize | 15.2 /100 | #197 | Poor 11.9% |
| Ukrainians | 14.7 /100 | #198 | Poor 11.9% |
| Immigrants | Panama | 14.6 /100 | #199 | Poor 11.9% |
| Belizeans | 12.8 /100 | #200 | Poor 11.9% |
| Assyrians/Chaldeans/Syriacs | 12.6 /100 | #201 | Poor 11.9% |
| Immigrants | England | 12.0 /100 | #202 | Poor 12.0% |
| British West Indians | 11.5 /100 | #203 | Poor 12.0% |
| Mexican American Indians | 11.4 /100 | #204 | Poor 12.0% |
| Immigrants | Western Europe | 10.1 /100 | #205 | Poor 12.0% |
| Immigrants | Senegal | 9.4 /100 | #206 | Tragic 12.0% |
| Immigrants | Thailand | 9.3 /100 | #207 | Tragic 12.0% |
| Immigrants | Caribbean | 9.1 /100 | #208 | Tragic 12.0% |