Immigrants from Mexico vs Menominee Disability
COMPARE
Immigrants from Mexico
Menominee
Disability
Disability Comparison
Immigrants from Mexico
Menominee
11.9%
DISABILITY
23.8/ 100
METRIC RATING
188th/ 347
METRIC RANK
13.8%
DISABILITY
0.0/ 100
METRIC RATING
318th/ 347
METRIC RANK
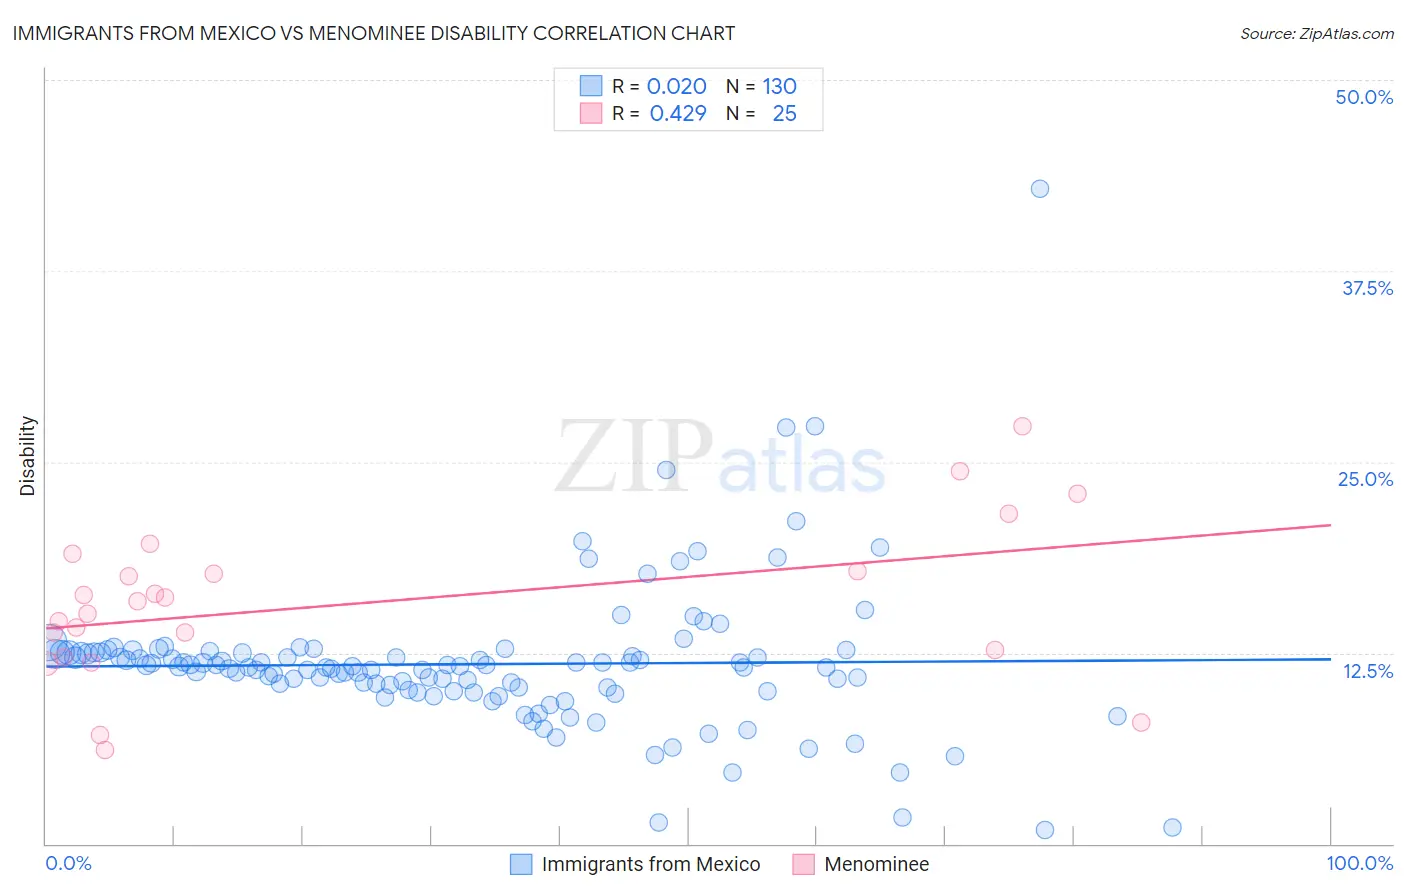
Immigrants from Mexico vs Menominee Disability Correlation Chart
The statistical analysis conducted on geographies consisting of 513,610,494 people shows no correlation between the proportion of Immigrants from Mexico and percentage of population with a disability in the United States with a correlation coefficient (R) of 0.020 and weighted average of 11.9%. Similarly, the statistical analysis conducted on geographies consisting of 45,777,730 people shows a moderate positive correlation between the proportion of Menominee and percentage of population with a disability in the United States with a correlation coefficient (R) of 0.429 and weighted average of 13.8%, a difference of 16.3%.
Disability Correlation Summary
| Measurement | Immigrants from Mexico | Menominee |
| Minimum | 0.89% | 6.2% |
| Maximum | 42.9% | 27.3% |
| Range | 42.0% | 21.2% |
| Mean | 11.8% | 15.8% |
| Median | 11.6% | 15.9% |
| Interquartile 25% (IQ1) | 10.1% | 12.4% |
| Interquartile 75% (IQ3) | 12.5% | 18.4% |
| Interquartile Range (IQR) | 2.4% | 6.0% |
| Standard Deviation (Sample) | 4.9% | 5.1% |
| Standard Deviation (Population) | 4.8% | 5.0% |
Similar Demographics by Disability
Demographics Similar to Immigrants from Mexico by Disability
In terms of disability, the demographic groups most similar to Immigrants from Mexico are Immigrants from Zaire (11.9%, a difference of 0.12%), Immigrants from West Indies (11.9%, a difference of 0.17%), Lebanese (11.8%, a difference of 0.24%), Immigrants from Scotland (11.8%, a difference of 0.26%), and Immigrants from Burma/Myanmar (11.8%, a difference of 0.27%).
| Demographics | Rating | Rank | Disability |
| Immigrants | Oceania | 34.3 /100 | #181 | Fair 11.8% |
| Icelanders | 34.0 /100 | #182 | Fair 11.8% |
| Hondurans | 31.2 /100 | #183 | Fair 11.8% |
| Iraqis | 30.0 /100 | #184 | Fair 11.8% |
| Immigrants | Burma/Myanmar | 28.5 /100 | #185 | Fair 11.8% |
| Immigrants | Scotland | 28.2 /100 | #186 | Fair 11.8% |
| Lebanese | 27.9 /100 | #187 | Fair 11.8% |
| Immigrants | Mexico | 23.8 /100 | #188 | Fair 11.9% |
| Immigrants | Zaire | 21.8 /100 | #189 | Fair 11.9% |
| Immigrants | West Indies | 21.1 /100 | #190 | Fair 11.9% |
| Ute | 19.5 /100 | #191 | Poor 11.9% |
| Lithuanians | 18.8 /100 | #192 | Poor 11.9% |
| Immigrants | Bosnia and Herzegovina | 18.0 /100 | #193 | Poor 11.9% |
| Somalis | 17.3 /100 | #194 | Poor 11.9% |
| Barbadians | 15.8 /100 | #195 | Poor 11.9% |
Demographics Similar to Menominee by Disability
In terms of disability, the demographic groups most similar to Menominee are Iroquois (13.8%, a difference of 0.21%), Apache (13.9%, a difference of 0.51%), Pima (13.7%, a difference of 0.58%), Immigrants from Cabo Verde (13.7%, a difference of 0.58%), and Puget Sound Salish (13.7%, a difference of 0.60%).
| Demographics | Rating | Rank | Disability |
| Delaware | 0.0 /100 | #311 | Tragic 13.6% |
| Spanish Americans | 0.0 /100 | #312 | Tragic 13.6% |
| Cree | 0.0 /100 | #313 | Tragic 13.7% |
| Blacks/African Americans | 0.0 /100 | #314 | Tragic 13.7% |
| Puget Sound Salish | 0.0 /100 | #315 | Tragic 13.7% |
| Pima | 0.0 /100 | #316 | Tragic 13.7% |
| Immigrants | Cabo Verde | 0.0 /100 | #317 | Tragic 13.7% |
| Menominee | 0.0 /100 | #318 | Tragic 13.8% |
| Iroquois | 0.0 /100 | #319 | Tragic 13.8% |
| Apache | 0.0 /100 | #320 | Tragic 13.9% |
| Paiute | 0.0 /100 | #321 | Tragic 13.9% |
| Americans | 0.0 /100 | #322 | Tragic 13.9% |
| Comanche | 0.0 /100 | #323 | Tragic 14.1% |
| Chippewa | 0.0 /100 | #324 | Tragic 14.1% |
| Natives/Alaskans | 0.0 /100 | #325 | Tragic 14.2% |