Immigrants from Mexico vs Central American Disability
COMPARE
Immigrants from Mexico
Central American
Disability
Disability Comparison
Immigrants from Mexico
Central Americans
11.9%
DISABILITY
23.8/ 100
METRIC RATING
188th/ 347
METRIC RANK
11.4%
DISABILITY
93.5/ 100
METRIC RATING
119th/ 347
METRIC RANK
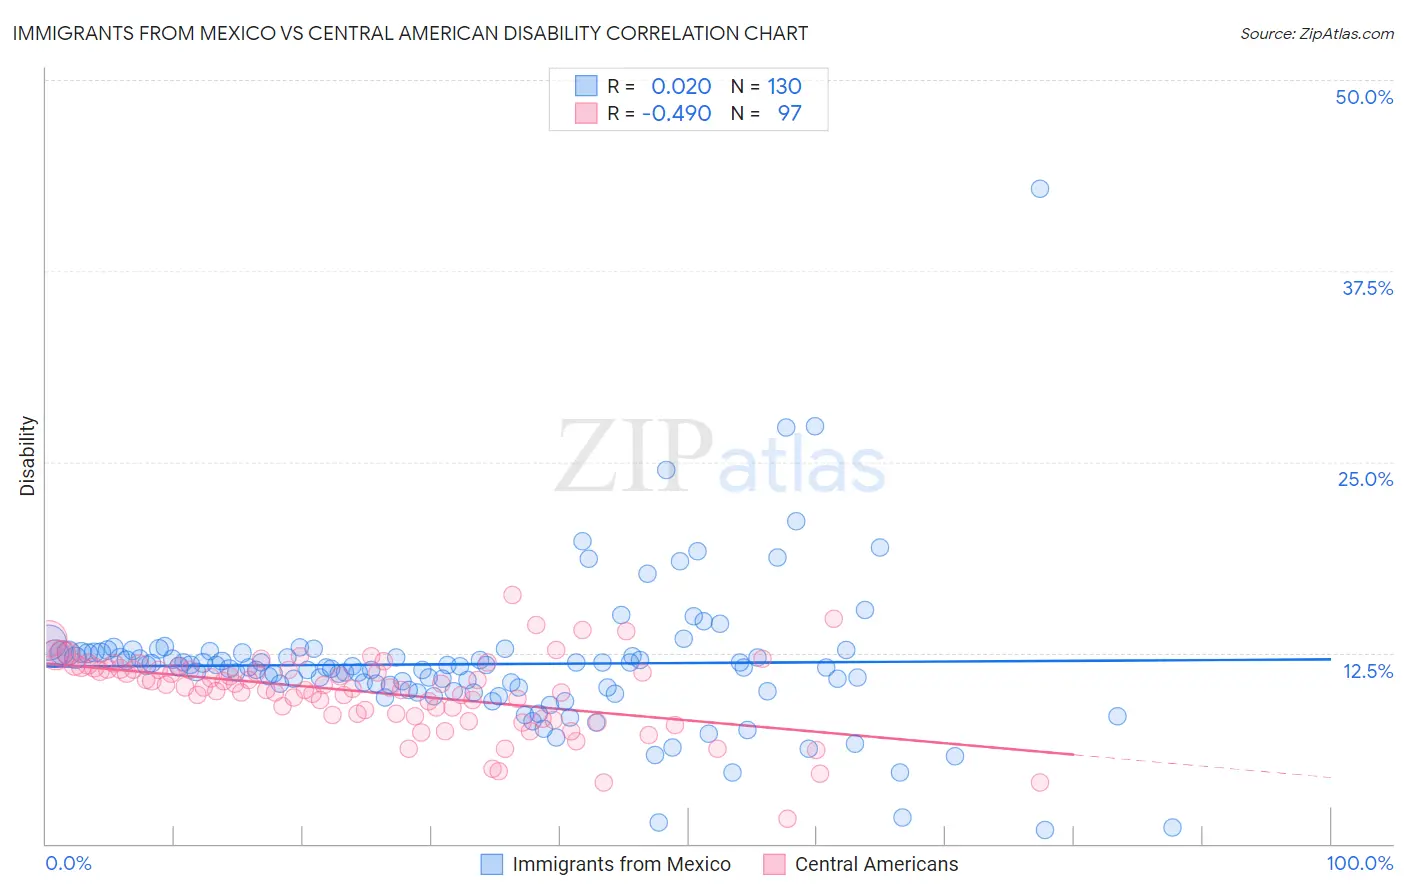
Immigrants from Mexico vs Central American Disability Correlation Chart
The statistical analysis conducted on geographies consisting of 513,610,494 people shows no correlation between the proportion of Immigrants from Mexico and percentage of population with a disability in the United States with a correlation coefficient (R) of 0.020 and weighted average of 11.9%. Similarly, the statistical analysis conducted on geographies consisting of 504,498,688 people shows a moderate negative correlation between the proportion of Central Americans and percentage of population with a disability in the United States with a correlation coefficient (R) of -0.490 and weighted average of 11.4%, a difference of 4.4%.
Disability Correlation Summary
| Measurement | Immigrants from Mexico | Central American |
| Minimum | 0.89% | 1.6% |
| Maximum | 42.9% | 16.3% |
| Range | 42.0% | 14.6% |
| Mean | 11.8% | 9.9% |
| Median | 11.6% | 10.3% |
| Interquartile 25% (IQ1) | 10.1% | 8.5% |
| Interquartile 75% (IQ3) | 12.5% | 11.4% |
| Interquartile Range (IQR) | 2.4% | 3.0% |
| Standard Deviation (Sample) | 4.9% | 2.5% |
| Standard Deviation (Population) | 4.8% | 2.5% |
Similar Demographics by Disability
Demographics Similar to Immigrants from Mexico by Disability
In terms of disability, the demographic groups most similar to Immigrants from Mexico are Immigrants from Zaire (11.9%, a difference of 0.12%), Immigrants from West Indies (11.9%, a difference of 0.17%), Lebanese (11.8%, a difference of 0.24%), Immigrants from Scotland (11.8%, a difference of 0.26%), and Immigrants from Burma/Myanmar (11.8%, a difference of 0.27%).
| Demographics | Rating | Rank | Disability |
| Immigrants | Oceania | 34.3 /100 | #181 | Fair 11.8% |
| Icelanders | 34.0 /100 | #182 | Fair 11.8% |
| Hondurans | 31.2 /100 | #183 | Fair 11.8% |
| Iraqis | 30.0 /100 | #184 | Fair 11.8% |
| Immigrants | Burma/Myanmar | 28.5 /100 | #185 | Fair 11.8% |
| Immigrants | Scotland | 28.2 /100 | #186 | Fair 11.8% |
| Lebanese | 27.9 /100 | #187 | Fair 11.8% |
| Immigrants | Mexico | 23.8 /100 | #188 | Fair 11.9% |
| Immigrants | Zaire | 21.8 /100 | #189 | Fair 11.9% |
| Immigrants | West Indies | 21.1 /100 | #190 | Fair 11.9% |
| Ute | 19.5 /100 | #191 | Poor 11.9% |
| Lithuanians | 18.8 /100 | #192 | Poor 11.9% |
| Immigrants | Bosnia and Herzegovina | 18.0 /100 | #193 | Poor 11.9% |
| Somalis | 17.3 /100 | #194 | Poor 11.9% |
| Barbadians | 15.8 /100 | #195 | Poor 11.9% |
Demographics Similar to Central Americans by Disability
In terms of disability, the demographic groups most similar to Central Americans are Immigrants from North Macedonia (11.4%, a difference of 0.0%), Immigrants from Costa Rica (11.4%, a difference of 0.010%), Brazilian (11.4%, a difference of 0.040%), Korean (11.3%, a difference of 0.050%), and Luxembourger (11.3%, a difference of 0.070%).
| Demographics | Rating | Rank | Disability |
| Immigrants | Uzbekistan | 94.9 /100 | #112 | Exceptional 11.3% |
| Guyanese | 94.7 /100 | #113 | Exceptional 11.3% |
| Immigrants | Syria | 94.7 /100 | #114 | Exceptional 11.3% |
| Immigrants | Philippines | 94.6 /100 | #115 | Exceptional 11.3% |
| Immigrants | Northern Europe | 94.1 /100 | #116 | Exceptional 11.3% |
| Luxembourgers | 93.9 /100 | #117 | Exceptional 11.3% |
| Koreans | 93.8 /100 | #118 | Exceptional 11.3% |
| Central Americans | 93.5 /100 | #119 | Exceptional 11.4% |
| Immigrants | North Macedonia | 93.5 /100 | #120 | Exceptional 11.4% |
| Immigrants | Costa Rica | 93.4 /100 | #121 | Exceptional 11.4% |
| Brazilians | 93.3 /100 | #122 | Exceptional 11.4% |
| South Africans | 92.3 /100 | #123 | Exceptional 11.4% |
| South American Indians | 92.2 /100 | #124 | Exceptional 11.4% |
| Costa Ricans | 91.9 /100 | #125 | Exceptional 11.4% |
| Immigrants | Latvia | 90.9 /100 | #126 | Exceptional 11.4% |