Immigrants from the Azores vs Immigrants from Romania Disability
COMPARE
Immigrants from the Azores
Immigrants from Romania
Disability
Disability Comparison
Immigrants from the Azores
Immigrants from Romania
14.2%
DISABILITY
0.0/ 100
METRIC RATING
328th/ 347
METRIC RANK
11.2%
DISABILITY
98.5/ 100
METRIC RATING
88th/ 347
METRIC RANK
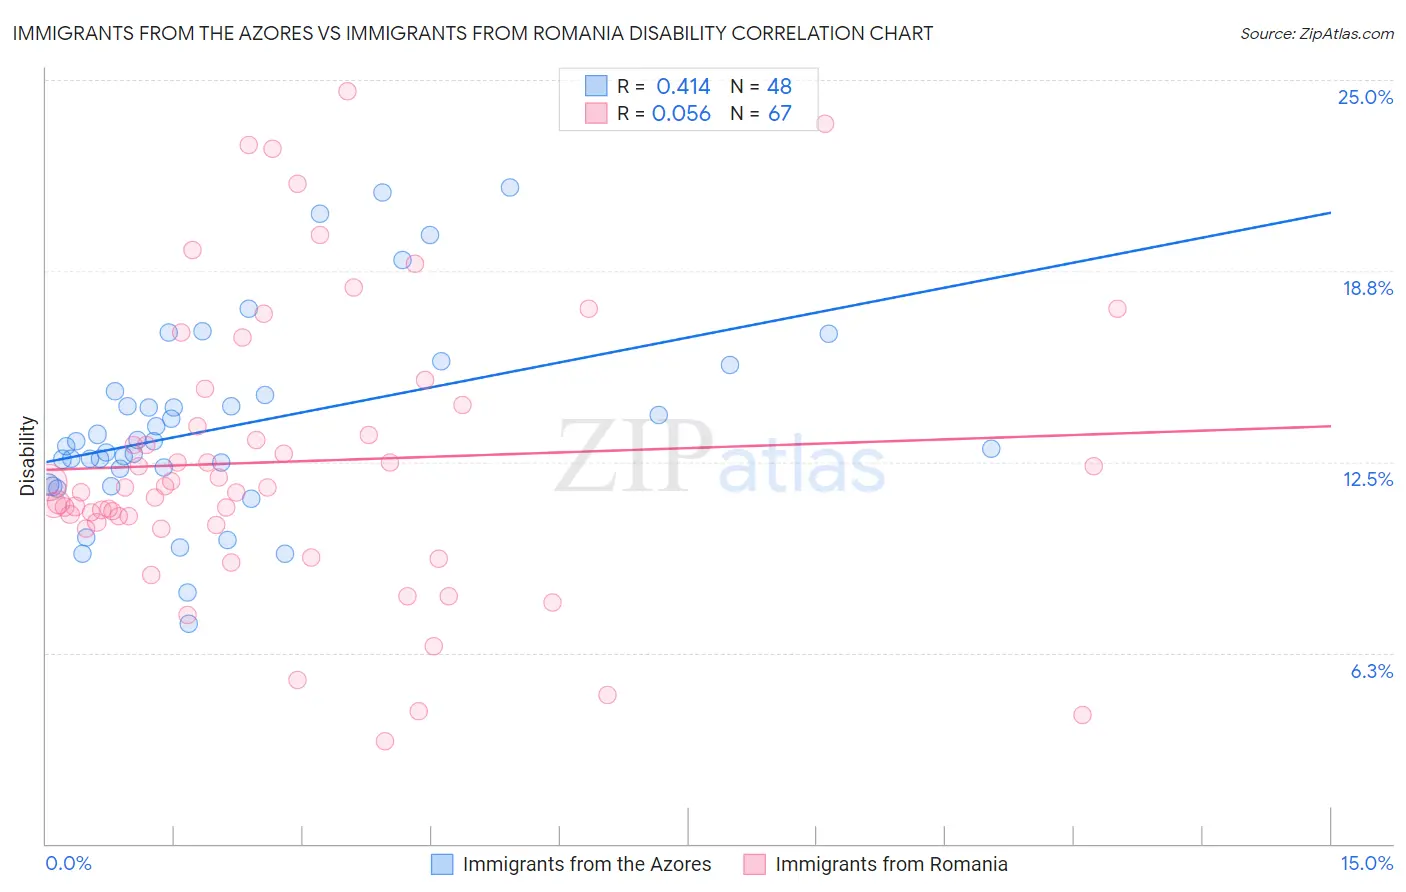
Immigrants from the Azores vs Immigrants from Romania Disability Correlation Chart
The statistical analysis conducted on geographies consisting of 46,257,178 people shows a moderate positive correlation between the proportion of Immigrants from the Azores and percentage of population with a disability in the United States with a correlation coefficient (R) of 0.414 and weighted average of 14.2%. Similarly, the statistical analysis conducted on geographies consisting of 256,993,596 people shows a slight positive correlation between the proportion of Immigrants from Romania and percentage of population with a disability in the United States with a correlation coefficient (R) of 0.056 and weighted average of 11.2%, a difference of 26.9%.
Disability Correlation Summary
| Measurement | Immigrants from the Azores | Immigrants from Romania |
| Minimum | 7.2% | 3.4% |
| Maximum | 21.5% | 24.6% |
| Range | 14.3% | 21.3% |
| Mean | 13.7% | 12.5% |
| Median | 13.1% | 11.6% |
| Interquartile 25% (IQ1) | 12.0% | 10.4% |
| Interquartile 75% (IQ3) | 14.8% | 14.4% |
| Interquartile Range (IQR) | 2.7% | 3.9% |
| Standard Deviation (Sample) | 3.2% | 4.6% |
| Standard Deviation (Population) | 3.1% | 4.6% |
Similar Demographics by Disability
Demographics Similar to Immigrants from the Azores by Disability
In terms of disability, the demographic groups most similar to Immigrants from the Azores are Ottawa (14.2%, a difference of 0.0%), Osage (14.2%, a difference of 0.020%), Native/Alaskan (14.2%, a difference of 0.060%), Chippewa (14.1%, a difference of 0.10%), and Potawatomi (14.2%, a difference of 0.12%).
| Demographics | Rating | Rank | Disability |
| Paiute | 0.0 /100 | #321 | Tragic 13.9% |
| Americans | 0.0 /100 | #322 | Tragic 13.9% |
| Comanche | 0.0 /100 | #323 | Tragic 14.1% |
| Chippewa | 0.0 /100 | #324 | Tragic 14.1% |
| Natives/Alaskans | 0.0 /100 | #325 | Tragic 14.2% |
| Osage | 0.0 /100 | #326 | Tragic 14.2% |
| Ottawa | 0.0 /100 | #327 | Tragic 14.2% |
| Immigrants | Azores | 0.0 /100 | #328 | Tragic 14.2% |
| Potawatomi | 0.0 /100 | #329 | Tragic 14.2% |
| Navajo | 0.0 /100 | #330 | Tragic 14.3% |
| Alaskan Athabascans | 0.0 /100 | #331 | Tragic 14.4% |
| Pueblo | 0.0 /100 | #332 | Tragic 14.4% |
| Cajuns | 0.0 /100 | #333 | Tragic 14.6% |
| Yuman | 0.0 /100 | #334 | Tragic 14.6% |
| Tohono O'odham | 0.0 /100 | #335 | Tragic 14.8% |
Demographics Similar to Immigrants from Romania by Disability
In terms of disability, the demographic groups most similar to Immigrants from Romania are Immigrants from South Africa (11.2%, a difference of 0.25%), Palestinian (11.1%, a difference of 0.29%), Immigrants from Brazil (11.2%, a difference of 0.30%), Immigrants from Western Asia (11.2%, a difference of 0.32%), and Immigrants from Belarus (11.1%, a difference of 0.33%).
| Demographics | Rating | Rank | Disability |
| Immigrants | Poland | 99.1 /100 | #81 | Exceptional 11.1% |
| Chileans | 99.1 /100 | #82 | Exceptional 11.1% |
| Immigrants | Switzerland | 99.0 /100 | #83 | Exceptional 11.1% |
| Immigrants | Sierra Leone | 99.0 /100 | #84 | Exceptional 11.1% |
| Immigrants | Belarus | 98.9 /100 | #85 | Exceptional 11.1% |
| Immigrants | Russia | 98.9 /100 | #86 | Exceptional 11.1% |
| Palestinians | 98.9 /100 | #87 | Exceptional 11.1% |
| Immigrants | Romania | 98.5 /100 | #88 | Exceptional 11.2% |
| Immigrants | South Africa | 98.2 /100 | #89 | Exceptional 11.2% |
| Immigrants | Brazil | 98.1 /100 | #90 | Exceptional 11.2% |
| Immigrants | Western Asia | 98.1 /100 | #91 | Exceptional 11.2% |
| Ecuadorians | 98.0 /100 | #92 | Exceptional 11.2% |
| Immigrants | Ecuador | 98.0 /100 | #93 | Exceptional 11.2% |
| Immigrants | Morocco | 97.8 /100 | #94 | Exceptional 11.2% |
| Eastern Europeans | 97.8 /100 | #95 | Exceptional 11.2% |