Immigrants from Mexico vs Immigrants from Malaysia Disability
COMPARE
Immigrants from Mexico
Immigrants from Malaysia
Disability
Disability Comparison
Immigrants from Mexico
Immigrants from Malaysia
11.9%
DISABILITY
23.8/ 100
METRIC RATING
188th/ 347
METRIC RANK
10.6%
DISABILITY
100.0/ 100
METRIC RATING
25th/ 347
METRIC RANK
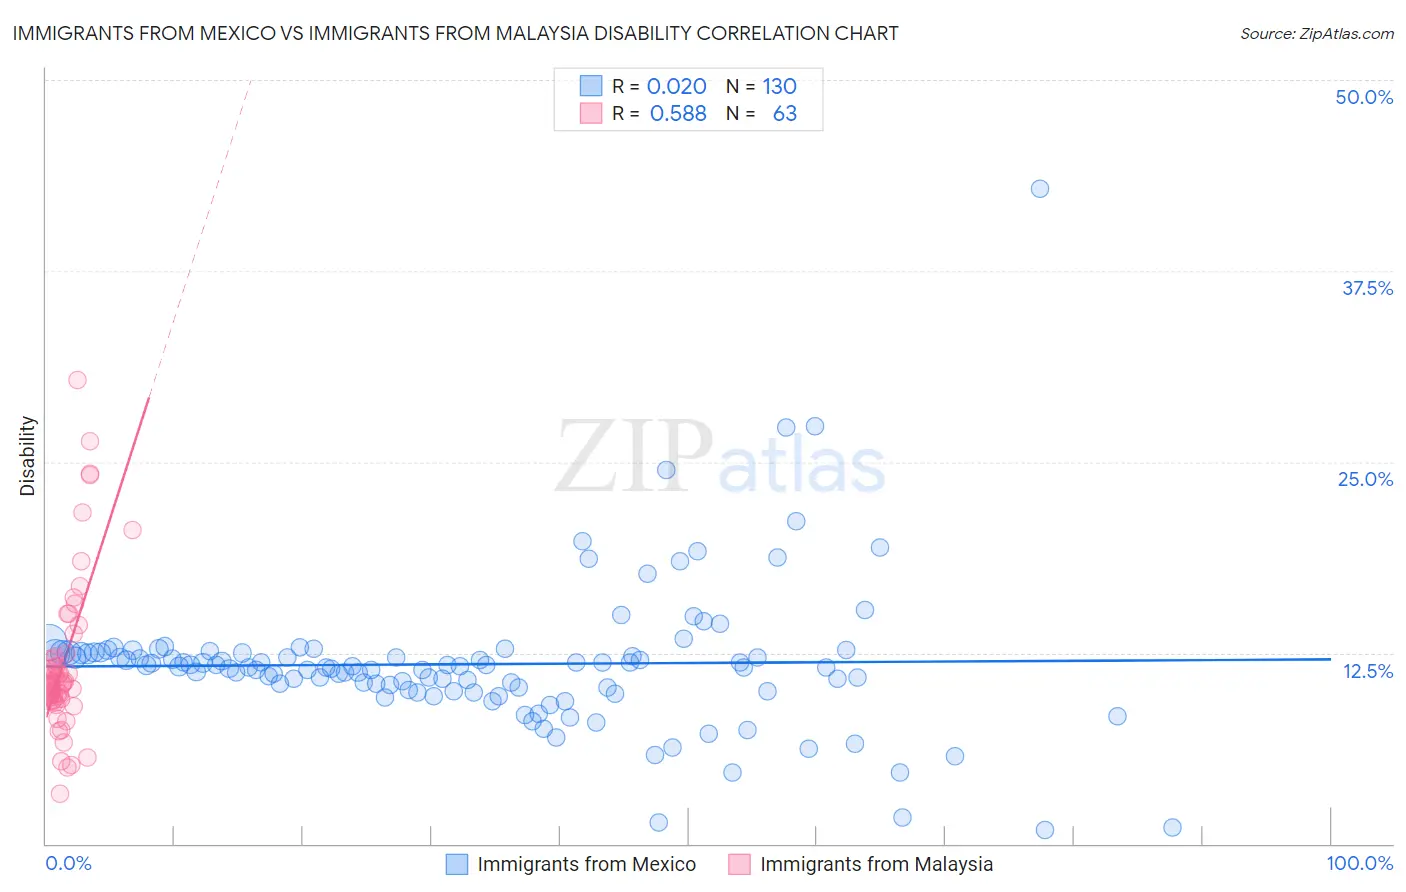
Immigrants from Mexico vs Immigrants from Malaysia Disability Correlation Chart
The statistical analysis conducted on geographies consisting of 513,610,494 people shows no correlation between the proportion of Immigrants from Mexico and percentage of population with a disability in the United States with a correlation coefficient (R) of 0.020 and weighted average of 11.9%. Similarly, the statistical analysis conducted on geographies consisting of 197,973,684 people shows a substantial positive correlation between the proportion of Immigrants from Malaysia and percentage of population with a disability in the United States with a correlation coefficient (R) of 0.588 and weighted average of 10.6%, a difference of 12.0%.
Disability Correlation Summary
| Measurement | Immigrants from Mexico | Immigrants from Malaysia |
| Minimum | 0.89% | 3.3% |
| Maximum | 42.9% | 30.4% |
| Range | 42.0% | 27.1% |
| Mean | 11.8% | 11.8% |
| Median | 11.6% | 10.5% |
| Interquartile 25% (IQ1) | 10.1% | 9.4% |
| Interquartile 75% (IQ3) | 12.5% | 12.3% |
| Interquartile Range (IQR) | 2.4% | 2.9% |
| Standard Deviation (Sample) | 4.9% | 5.1% |
| Standard Deviation (Population) | 4.8% | 5.1% |
Similar Demographics by Disability
Demographics Similar to Immigrants from Mexico by Disability
In terms of disability, the demographic groups most similar to Immigrants from Mexico are Immigrants from Zaire (11.9%, a difference of 0.12%), Immigrants from West Indies (11.9%, a difference of 0.17%), Lebanese (11.8%, a difference of 0.24%), Immigrants from Scotland (11.8%, a difference of 0.26%), and Immigrants from Burma/Myanmar (11.8%, a difference of 0.27%).
| Demographics | Rating | Rank | Disability |
| Immigrants | Oceania | 34.3 /100 | #181 | Fair 11.8% |
| Icelanders | 34.0 /100 | #182 | Fair 11.8% |
| Hondurans | 31.2 /100 | #183 | Fair 11.8% |
| Iraqis | 30.0 /100 | #184 | Fair 11.8% |
| Immigrants | Burma/Myanmar | 28.5 /100 | #185 | Fair 11.8% |
| Immigrants | Scotland | 28.2 /100 | #186 | Fair 11.8% |
| Lebanese | 27.9 /100 | #187 | Fair 11.8% |
| Immigrants | Mexico | 23.8 /100 | #188 | Fair 11.9% |
| Immigrants | Zaire | 21.8 /100 | #189 | Fair 11.9% |
| Immigrants | West Indies | 21.1 /100 | #190 | Fair 11.9% |
| Ute | 19.5 /100 | #191 | Poor 11.9% |
| Lithuanians | 18.8 /100 | #192 | Poor 11.9% |
| Immigrants | Bosnia and Herzegovina | 18.0 /100 | #193 | Poor 11.9% |
| Somalis | 17.3 /100 | #194 | Poor 11.9% |
| Barbadians | 15.8 /100 | #195 | Poor 11.9% |
Demographics Similar to Immigrants from Malaysia by Disability
In terms of disability, the demographic groups most similar to Immigrants from Malaysia are Argentinean (10.6%, a difference of 0.050%), Cypriot (10.6%, a difference of 0.060%), Egyptian (10.6%, a difference of 0.19%), Immigrants from Argentina (10.6%, a difference of 0.31%), and Venezuelan (10.5%, a difference of 0.38%).
| Demographics | Rating | Rank | Disability |
| Burmese | 100.0 /100 | #18 | Exceptional 10.4% |
| Immigrants | Pakistan | 100.0 /100 | #19 | Exceptional 10.4% |
| Immigrants | Venezuela | 100.0 /100 | #20 | Exceptional 10.4% |
| Asians | 100.0 /100 | #21 | Exceptional 10.4% |
| Immigrants | Sri Lanka | 100.0 /100 | #22 | Exceptional 10.5% |
| Immigrants | Asia | 100.0 /100 | #23 | Exceptional 10.5% |
| Venezuelans | 100.0 /100 | #24 | Exceptional 10.5% |
| Immigrants | Malaysia | 100.0 /100 | #25 | Exceptional 10.6% |
| Argentineans | 100.0 /100 | #26 | Exceptional 10.6% |
| Cypriots | 100.0 /100 | #27 | Exceptional 10.6% |
| Egyptians | 100.0 /100 | #28 | Exceptional 10.6% |
| Immigrants | Argentina | 100.0 /100 | #29 | Exceptional 10.6% |
| Immigrants | Turkey | 100.0 /100 | #30 | Exceptional 10.6% |
| Immigrants | Egypt | 100.0 /100 | #31 | Exceptional 10.6% |
| Paraguayans | 100.0 /100 | #32 | Exceptional 10.6% |