U.S. Virgin Islander vs Immigrants from Romania Disability
COMPARE
U.S. Virgin Islander
Immigrants from Romania
Disability
Disability Comparison
U.S. Virgin Islanders
Immigrants from Romania
12.5%
DISABILITY
0.2/ 100
METRIC RATING
265th/ 347
METRIC RANK
11.2%
DISABILITY
98.5/ 100
METRIC RATING
88th/ 347
METRIC RANK
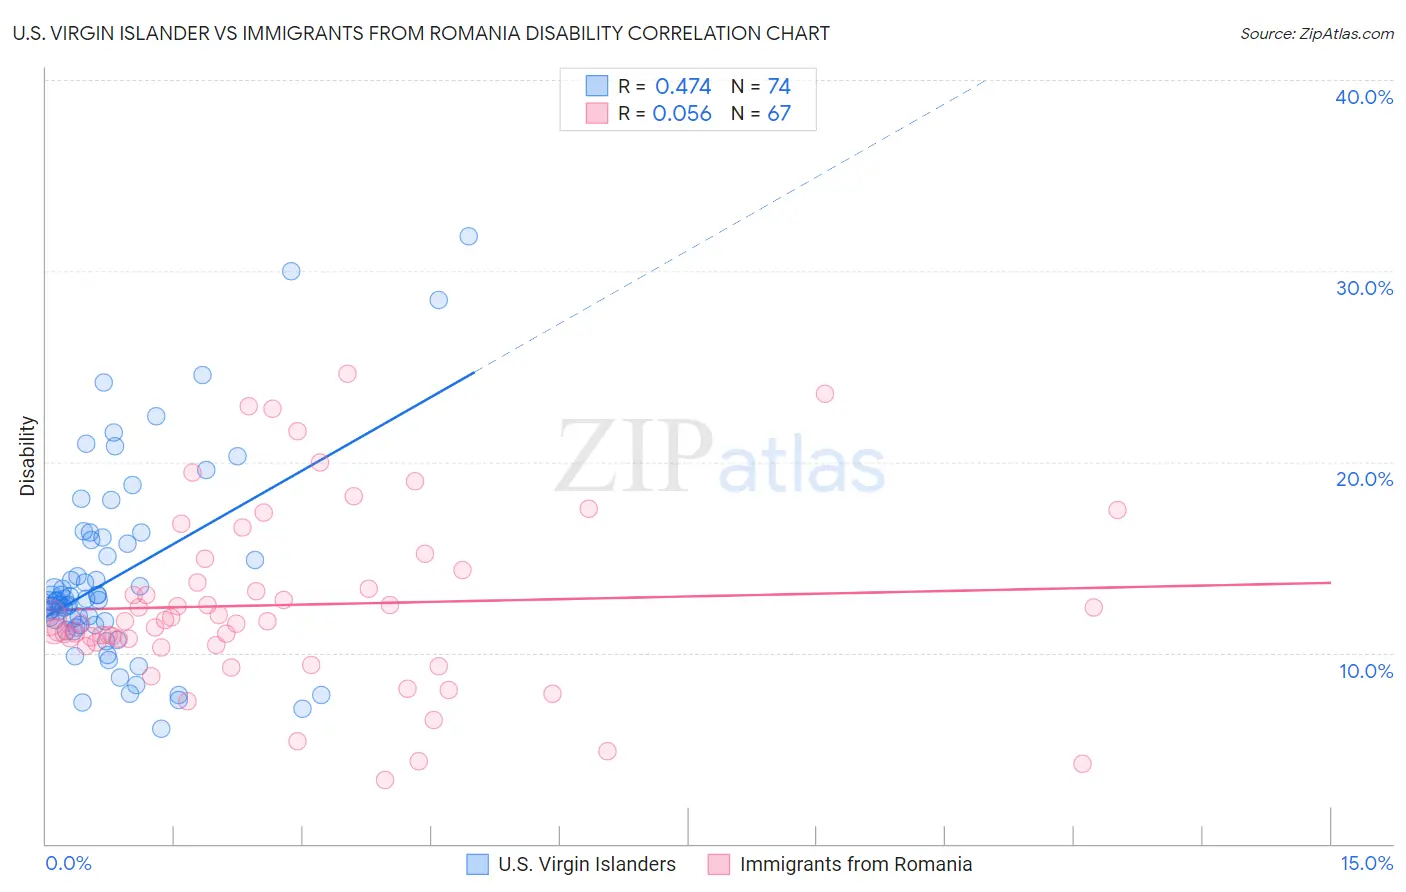
U.S. Virgin Islander vs Immigrants from Romania Disability Correlation Chart
The statistical analysis conducted on geographies consisting of 87,526,071 people shows a moderate positive correlation between the proportion of U.S. Virgin Islanders and percentage of population with a disability in the United States with a correlation coefficient (R) of 0.474 and weighted average of 12.5%. Similarly, the statistical analysis conducted on geographies consisting of 256,993,596 people shows a slight positive correlation between the proportion of Immigrants from Romania and percentage of population with a disability in the United States with a correlation coefficient (R) of 0.056 and weighted average of 11.2%, a difference of 12.0%.
Disability Correlation Summary
| Measurement | U.S. Virgin Islander | Immigrants from Romania |
| Minimum | 6.0% | 3.4% |
| Maximum | 31.8% | 24.6% |
| Range | 25.8% | 21.3% |
| Mean | 14.0% | 12.5% |
| Median | 12.8% | 11.6% |
| Interquartile 25% (IQ1) | 11.5% | 10.4% |
| Interquartile 75% (IQ3) | 15.9% | 14.4% |
| Interquartile Range (IQR) | 4.5% | 3.9% |
| Standard Deviation (Sample) | 5.2% | 4.6% |
| Standard Deviation (Population) | 5.1% | 4.6% |
Similar Demographics by Disability
Demographics Similar to U.S. Virgin Islanders by Disability
In terms of disability, the demographic groups most similar to U.S. Virgin Islanders are Immigrants from Germany (12.5%, a difference of 0.020%), Hawaiian (12.5%, a difference of 0.13%), Czechoslovakian (12.5%, a difference of 0.16%), Spaniard (12.5%, a difference of 0.24%), and Native Hawaiian (12.5%, a difference of 0.33%).
| Demographics | Rating | Rank | Disability |
| Slavs | 0.5 /100 | #258 | Tragic 12.4% |
| Canadians | 0.4 /100 | #259 | Tragic 12.4% |
| Immigrants | Liberia | 0.4 /100 | #260 | Tragic 12.4% |
| Scandinavians | 0.4 /100 | #261 | Tragic 12.4% |
| Native Hawaiians | 0.3 /100 | #262 | Tragic 12.5% |
| Hawaiians | 0.2 /100 | #263 | Tragic 12.5% |
| Immigrants | Germany | 0.2 /100 | #264 | Tragic 12.5% |
| U.S. Virgin Islanders | 0.2 /100 | #265 | Tragic 12.5% |
| Czechoslovakians | 0.2 /100 | #266 | Tragic 12.5% |
| Spaniards | 0.2 /100 | #267 | Tragic 12.5% |
| Bangladeshis | 0.1 /100 | #268 | Tragic 12.6% |
| Immigrants | Dominican Republic | 0.1 /100 | #269 | Tragic 12.6% |
| Portuguese | 0.1 /100 | #270 | Tragic 12.6% |
| Immigrants | Yemen | 0.1 /100 | #271 | Tragic 12.6% |
| Dominicans | 0.0 /100 | #272 | Tragic 12.7% |
Demographics Similar to Immigrants from Romania by Disability
In terms of disability, the demographic groups most similar to Immigrants from Romania are Immigrants from South Africa (11.2%, a difference of 0.25%), Palestinian (11.1%, a difference of 0.29%), Immigrants from Brazil (11.2%, a difference of 0.30%), Immigrants from Western Asia (11.2%, a difference of 0.32%), and Immigrants from Belarus (11.1%, a difference of 0.33%).
| Demographics | Rating | Rank | Disability |
| Immigrants | Poland | 99.1 /100 | #81 | Exceptional 11.1% |
| Chileans | 99.1 /100 | #82 | Exceptional 11.1% |
| Immigrants | Switzerland | 99.0 /100 | #83 | Exceptional 11.1% |
| Immigrants | Sierra Leone | 99.0 /100 | #84 | Exceptional 11.1% |
| Immigrants | Belarus | 98.9 /100 | #85 | Exceptional 11.1% |
| Immigrants | Russia | 98.9 /100 | #86 | Exceptional 11.1% |
| Palestinians | 98.9 /100 | #87 | Exceptional 11.1% |
| Immigrants | Romania | 98.5 /100 | #88 | Exceptional 11.2% |
| Immigrants | South Africa | 98.2 /100 | #89 | Exceptional 11.2% |
| Immigrants | Brazil | 98.1 /100 | #90 | Exceptional 11.2% |
| Immigrants | Western Asia | 98.1 /100 | #91 | Exceptional 11.2% |
| Ecuadorians | 98.0 /100 | #92 | Exceptional 11.2% |
| Immigrants | Ecuador | 98.0 /100 | #93 | Exceptional 11.2% |
| Immigrants | Morocco | 97.8 /100 | #94 | Exceptional 11.2% |
| Eastern Europeans | 97.8 /100 | #95 | Exceptional 11.2% |