Austrian vs Immigrants from Malaysia Disability
COMPARE
Austrian
Immigrants from Malaysia
Disability
Disability Comparison
Austrians
Immigrants from Malaysia
12.0%
DISABILITY
7.2/ 100
METRIC RATING
212th/ 347
METRIC RANK
10.6%
DISABILITY
100.0/ 100
METRIC RATING
25th/ 347
METRIC RANK
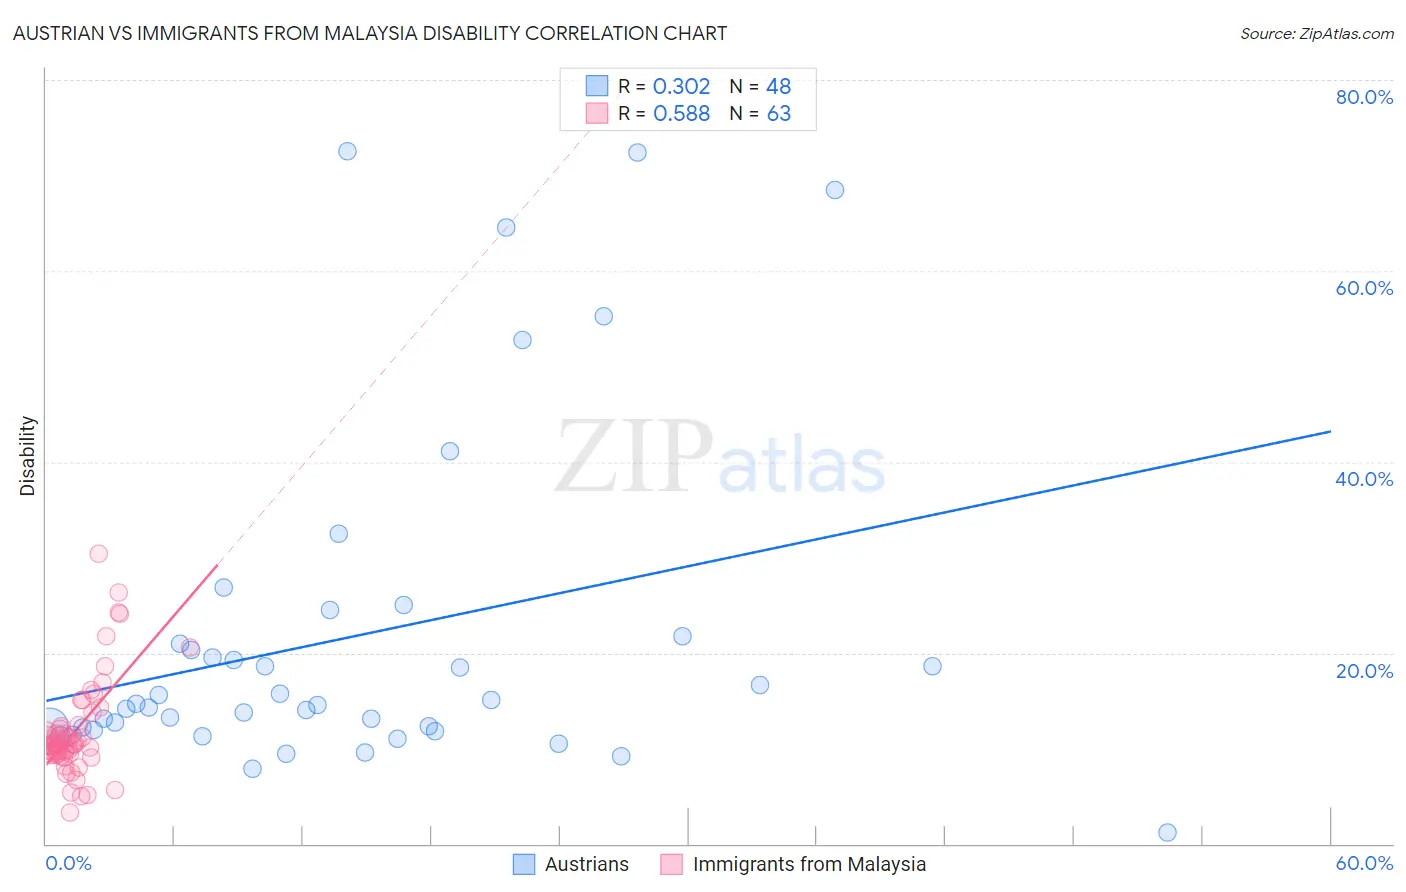
Austrian vs Immigrants from Malaysia Disability Correlation Chart
The statistical analysis conducted on geographies consisting of 452,057,102 people shows a mild positive correlation between the proportion of Austrians and percentage of population with a disability in the United States with a correlation coefficient (R) of 0.302 and weighted average of 12.0%. Similarly, the statistical analysis conducted on geographies consisting of 197,973,684 people shows a substantial positive correlation between the proportion of Immigrants from Malaysia and percentage of population with a disability in the United States with a correlation coefficient (R) of 0.588 and weighted average of 10.6%, a difference of 13.7%.
Disability Correlation Summary
| Measurement | Austrian | Immigrants from Malaysia |
| Minimum | 1.2% | 3.3% |
| Maximum | 72.5% | 30.4% |
| Range | 71.4% | 27.1% |
| Mean | 21.8% | 11.8% |
| Median | 14.6% | 10.5% |
| Interquartile 25% (IQ1) | 12.1% | 9.4% |
| Interquartile 75% (IQ3) | 21.4% | 12.3% |
| Interquartile Range (IQR) | 9.3% | 2.9% |
| Standard Deviation (Sample) | 17.7% | 5.1% |
| Standard Deviation (Population) | 17.5% | 5.1% |
Similar Demographics by Disability
Demographics Similar to Austrians by Disability
In terms of disability, the demographic groups most similar to Austrians are Immigrants from Iraq (12.0%, a difference of 0.010%), Immigrants from Cambodia (12.0%, a difference of 0.030%), Immigrants from Somalia (12.0%, a difference of 0.060%), Czech (12.0%, a difference of 0.11%), and Immigrants from Canada (12.1%, a difference of 0.18%).
| Demographics | Rating | Rank | Disability |
| Immigrants | Western Europe | 10.1 /100 | #205 | Poor 12.0% |
| Immigrants | Senegal | 9.4 /100 | #206 | Tragic 12.0% |
| Immigrants | Thailand | 9.3 /100 | #207 | Tragic 12.0% |
| Immigrants | Caribbean | 9.1 /100 | #208 | Tragic 12.0% |
| Danes | 8.7 /100 | #209 | Tragic 12.0% |
| Czechs | 7.9 /100 | #210 | Tragic 12.0% |
| Immigrants | Cambodia | 7.3 /100 | #211 | Tragic 12.0% |
| Austrians | 7.2 /100 | #212 | Tragic 12.0% |
| Immigrants | Iraq | 7.1 /100 | #213 | Tragic 12.0% |
| Immigrants | Somalia | 6.8 /100 | #214 | Tragic 12.0% |
| Immigrants | Canada | 6.1 /100 | #215 | Tragic 12.1% |
| Panamanians | 5.4 /100 | #216 | Tragic 12.1% |
| Immigrants | North America | 5.3 /100 | #217 | Tragic 12.1% |
| Immigrants | Jamaica | 5.0 /100 | #218 | Tragic 12.1% |
| Croatians | 4.9 /100 | #219 | Tragic 12.1% |
Demographics Similar to Immigrants from Malaysia by Disability
In terms of disability, the demographic groups most similar to Immigrants from Malaysia are Argentinean (10.6%, a difference of 0.050%), Cypriot (10.6%, a difference of 0.060%), Egyptian (10.6%, a difference of 0.19%), Immigrants from Argentina (10.6%, a difference of 0.31%), and Venezuelan (10.5%, a difference of 0.38%).
| Demographics | Rating | Rank | Disability |
| Burmese | 100.0 /100 | #18 | Exceptional 10.4% |
| Immigrants | Pakistan | 100.0 /100 | #19 | Exceptional 10.4% |
| Immigrants | Venezuela | 100.0 /100 | #20 | Exceptional 10.4% |
| Asians | 100.0 /100 | #21 | Exceptional 10.4% |
| Immigrants | Sri Lanka | 100.0 /100 | #22 | Exceptional 10.5% |
| Immigrants | Asia | 100.0 /100 | #23 | Exceptional 10.5% |
| Venezuelans | 100.0 /100 | #24 | Exceptional 10.5% |
| Immigrants | Malaysia | 100.0 /100 | #25 | Exceptional 10.6% |
| Argentineans | 100.0 /100 | #26 | Exceptional 10.6% |
| Cypriots | 100.0 /100 | #27 | Exceptional 10.6% |
| Egyptians | 100.0 /100 | #28 | Exceptional 10.6% |
| Immigrants | Argentina | 100.0 /100 | #29 | Exceptional 10.6% |
| Immigrants | Turkey | 100.0 /100 | #30 | Exceptional 10.6% |
| Immigrants | Egypt | 100.0 /100 | #31 | Exceptional 10.6% |
| Paraguayans | 100.0 /100 | #32 | Exceptional 10.6% |